Comparable Filled Radial Chart – Intuitive Data Analysis
RJ0800005_15
- Last Update 08/01/2025
- File Size 11.5MB
- # of Slides 2
- File Format PPTX
- Slide Ratio 16:9
- Color
Keywords
- #Content-Based Slides
- #Design-Based Slides
- #Product/Service Introduction
- #Market and Competitor Analysis
- #Diagram
- #Graph
- #Features
- #Competitive Advantage
- #Cluster
- #Other
- #Chain Diagram
- #Radar Chart Spider Chart
- #16:9
- #radial chart PowerPoint
- #radar chart template
- #5-axis comparison slide
- #data analysis PowerPoint
- #radial diagram presentation
- #competitive analysis slide template
About the Product
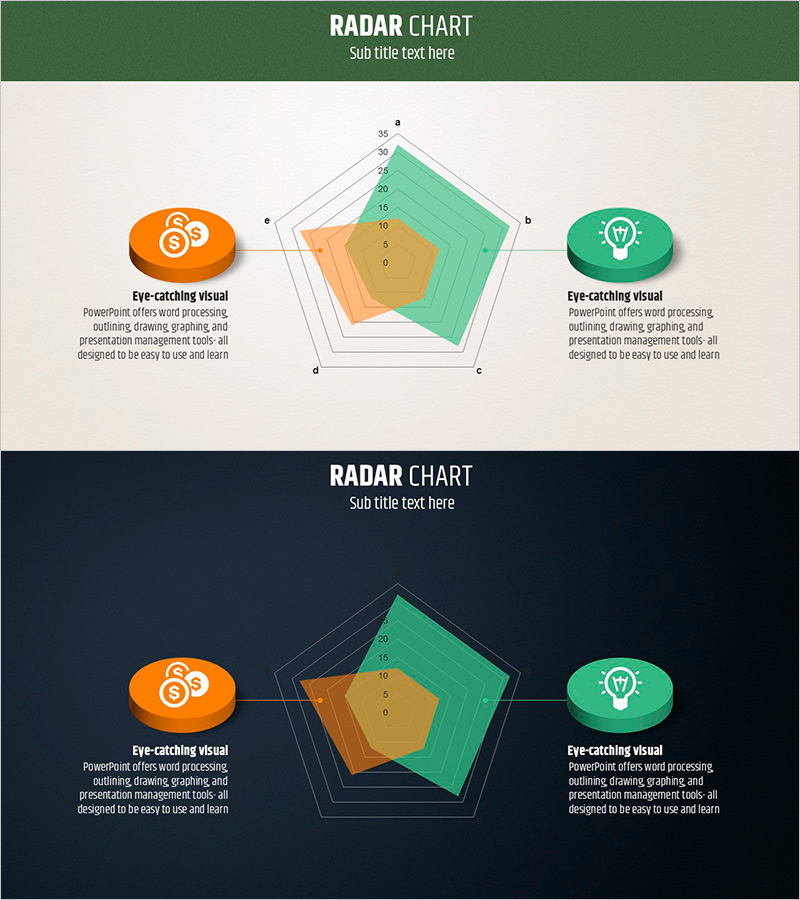
A 2-slide PowerPoint radial chart template featuring a 5-axis radar diagram with orange and green dual-tone data series for intuitive side-by-side comparison. Each axis displays a 0–35 numerical scale, with icon and text areas positioned on both left and right sides to showcase product features, market positioning, or capability benchmarking. The slides are ready to use in presentations and reports, supporting immediate customization of data values and descriptions.
Usage Points
-
Main Usage
Compares two or more data series across five dimensions simultaneously, making it ideal for product/service differentiation, competitive benchmarking, organizational capability assessment, or market positioning analysis.
-
How to Use
Replace axis values with your actual data, update left and right text boxes with comparison labels and descriptions. The dual-tone color scheme is pre-applied, allowing direct insertion into presentations without additional formatting.
-
Recommended For
Product launch presentations, market analysis reports, executive briefings, marketing strategy decks, and capability assessments. Best suited for marketing, product management, sales, and executive audiences.
-
Slide Structure
Central 5-axis radial chart with orange and green data regions, left-side orange icon and text box, right-side green icon and text box, title area at top. Two background color variants provided: beige and dark navy.
Related Products
-

Sailing Travel Risk Management Radar Chart
#Product/Service Introduction #Business Introduction #Diagram
-

Product Comparison Radar Chart – Competitive Advantage Analysis
#Product/Service Introduction #Market and Competitor Analysis #Graph
-

Two Radial Graphs for Product Feature Comparison – Highlighting Competitive Advantage
#Product/Service Introduction #Market and Competitor Analysis #Graph
-

Stylish Design Charm – Presentation Template
#Product/Service Introduction #Diagram #Features
