Mokup and Turnout Analysis Chart – Analyze with Visual Data
RJ0800005_17
- Last Update 08/01/2025
- File Size 11.6MB
- # of Slides 2
- File Format PPTX
- Slide Ratio 16:9
- Color
Keywords
- #Content-Based Slides
- #Design-Based Slides
- #Market and Competitor Analysis
- #Graph
- #Other
- #Market Share
- #Market Analysis
- #Circles
- #Doughnut Chart
- #Mockup
- #16:9
- #doughnut chart PowerPoint
- #pie chart slide template
- #laptop mockup presentation
- #voting rate analysis
- #data visualization slide
- #chart PowerPoint template download
About the Product
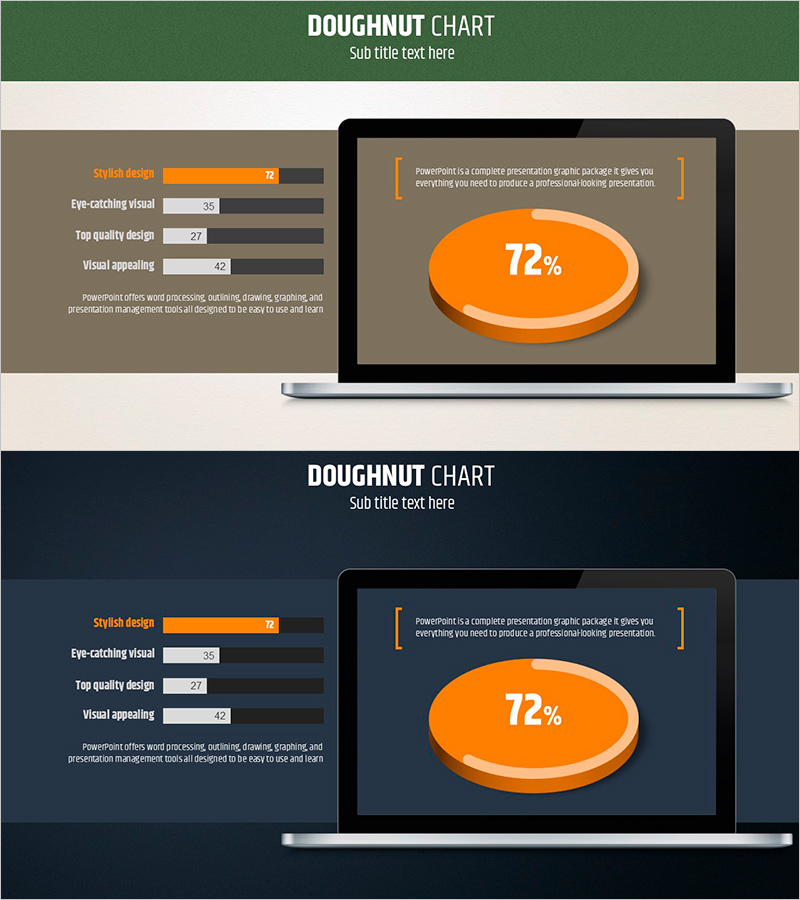
A 2-slide PowerPoint set combining a laptop screen mockup with an orange doughnut chart for presenting single-ratio data such as voting rates, market share, or satisfaction scores. The left side displays a horizontal bar graph comparing four metrics (Stylish Design 72, Eye-catching Visual 35, Top Quality Design 27, Visual Appealing 42), while the right side features a large doughnut chart on a notebook mockup to emphasize key percentages. The design uses brown, gray, and black backgrounds with orange accent colors to achieve both professionalism and visual contrast in your presentation slides.
Usage Points
-
Main Usage
Visualize single-ratio data such as voting percentages, market share, satisfaction scores, or achievement rates alongside a laptop mockup to enhance both credibility and impact in presentations. Ideal for policy reports, marketing analysis, and survey result presentations.
-
How to Use
Edit the left bar graph by entering your specific metrics and values, then update the doughnut chart percentage to match your actual data. Keep the laptop mockup image fixed and modify only the chart colors and numbers for immediate use in your presentation.
-
Recommended For
Policy analysts, marketing professionals, market researchers, voting result presenters, and satisfaction survey coordinators presenting data-driven insights. Suitable for government reports, corporate analysis materials, and academic presentations.
-
Slide Structure
2-slide layout: Slide 1 features a brown background with a left-side horizontal bar graph (4 items: 72, 35, 27, 42 values) and right-side laptop mockup; Slide 2 uses a dark background with identical structure. The doughnut chart displays a single orange color series with 3D perspective effect representing the 72% ratio.
Related Products
-

Simple Car Wide Presentation Map&Donut Chart – Market Share Analysis
#Market and Competitor Analysis #Graph #Other
-

Soccer Match Analysis Chart – Performance Analysis and Future Forecast
#Business Vision and Strategy #Market and Competitor Analysis #Graph
-

Donut Chart Visualizing Merchandise Sales Proportion
#Market and Competitor Analysis #Graph #Market Share
-

Work Progress Analysis Graph – Market Share Visualization
#Market and Competitor Analysis #Graph #Market Share
