Donut Chart Slide for Market Share Analysis
RJ0200018_10
- Last Update 04/02/2025
- File Size 1.2MB
- # of Slides 2
- File Format PPTX
- Slide Ratio 16:9
- Color
Keywords
About the Product
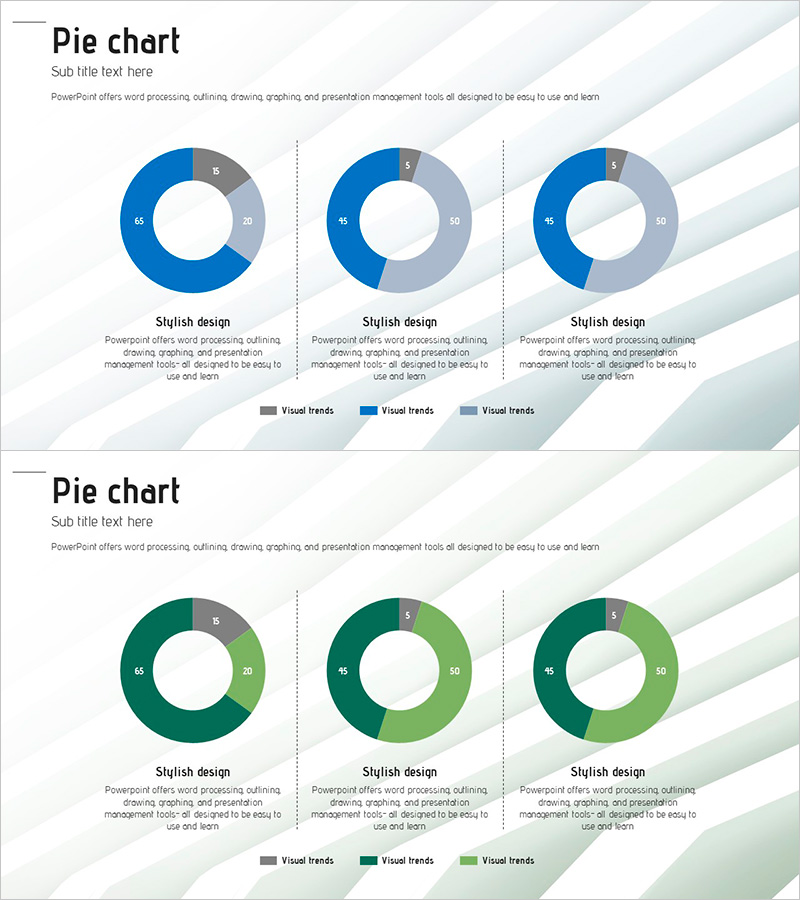
A professional donut chart PowerPoint slide designed for market share analysis and competitive comparison. This 2-slide template features blue and green color schemes, each displaying a 3-segment donut chart with a central space for highlighting key metrics. The 16:9 widescreen PPTX format is fully editable and ready for immediate use in marketing reports, business analysis presentations, and strategic planning documents. Both slides share the same structure, allowing you to compare multiple data sets side by side for comprehensive market insights.
Usage Points
-
Main Usage
Visualize proportional data such as market share, revenue distribution, and customer composition using donut charts. The central circular space accommodates key metrics or percentages, emphasizing competitive advantages and market positioning at a glance.
-
How to Use
Insert into market analysis sections of marketing reports, competitive analysis pages of business plans, and quarterly performance presentations. Simply update the numerical values and legend labels to match your data, and adjust colors to align with your brand identity.
-
Recommended For
Marketing managers, business strategists, financial analysts, and executives preparing data-driven presentations. Ideal for startup pitch decks, corporate analysis reports, strategic planning meetings, and investor presentations.
-
Slide Structure
2-slide template with one 3-segment donut chart per slide. Blue color series (dark blue, light blue, gray) and green color series (dark green, light green, gray) provide visual distinction. Each chart includes a legend and descriptive text area below for context and interpretation.
Related Products
-

Market Share Analysis Donut Circle Graph – Strengthening Competitiveness
#Market and Competitor Analysis #Graph #Competitor Analysis
-

Blue Green Progress Visualization – Graph for Achievement Rate
#Product/Service Introduction #Business Strategy #Market and Competitor Analysis
-

Analysis of Cigarette Types by Situation – Utilizing Doughnut Chart
#Market and Competitor Analysis #Graph #Competitor Analysis
-

Magic Donut Chart for Market Share Visualization – Key Information Delivery
#Product/Service Introduction #Market and Competitor Analysis #Diagram
