Business Dream Wide Presentation – Sleek and Professional Design
J0300057
- Last Update 06/18/2025
- File Size 24.4MB
- # of Slides 21
- File Format PPTX
- Slide Ratio 16:9
- Color
Slide Preview


Keywords
About the Product
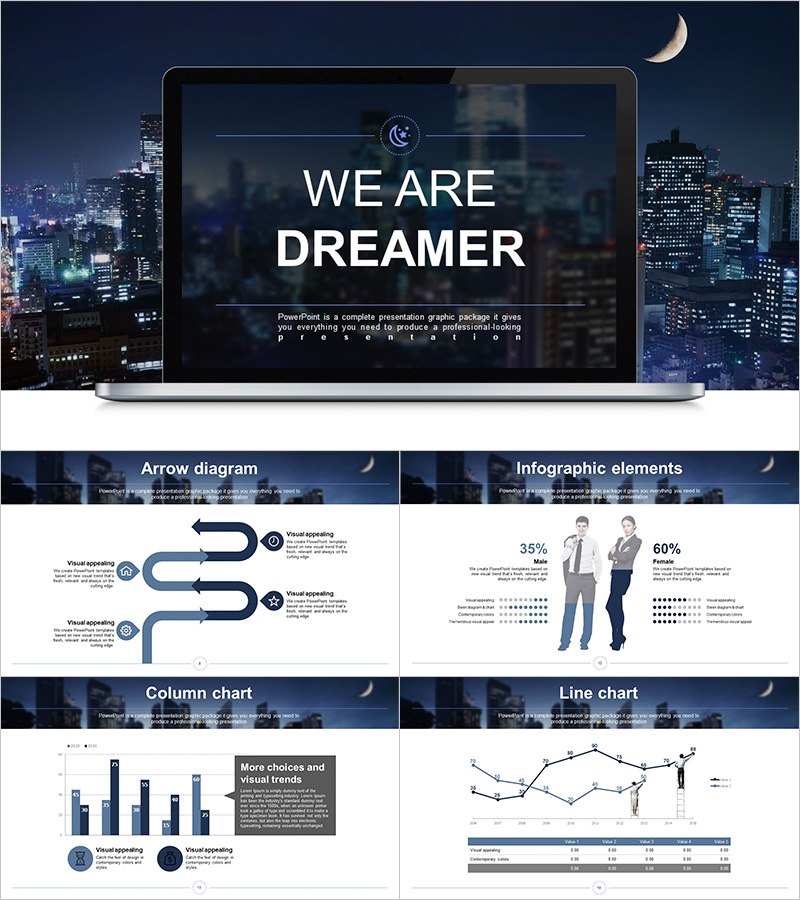
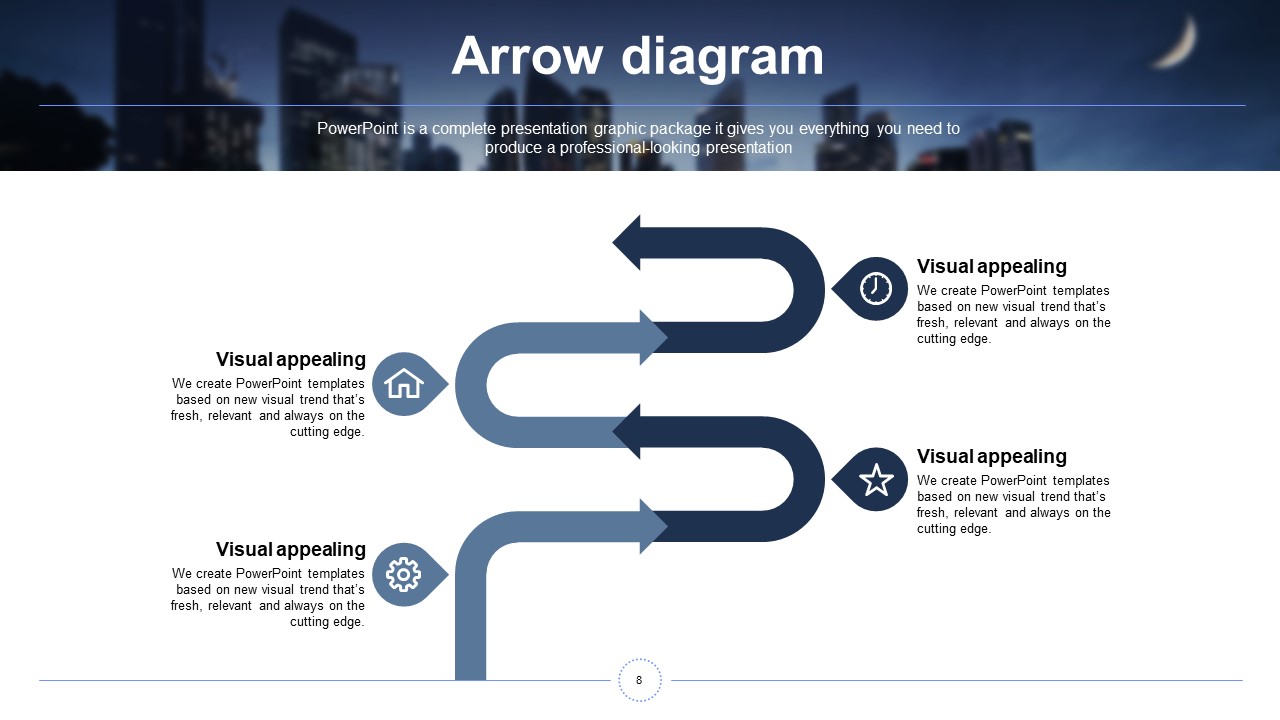
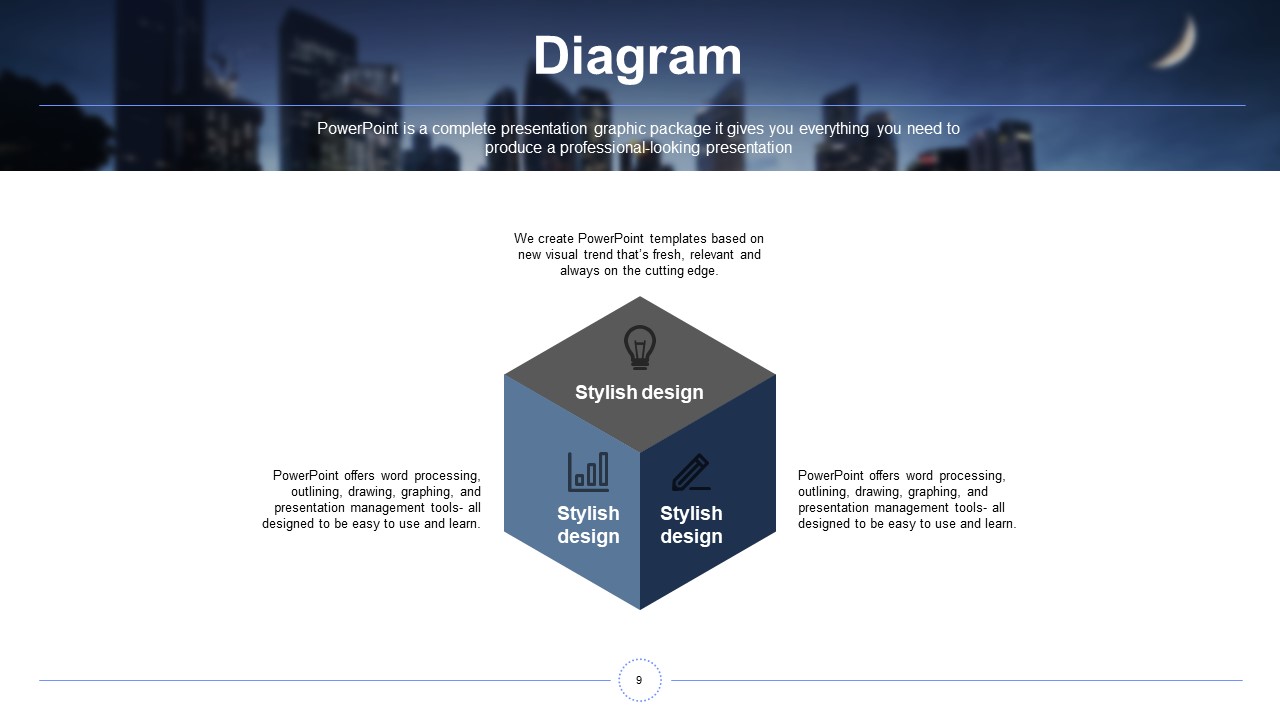
A professional business PowerPoint template featuring a dramatic dark navy and deep blue color scheme with a city night skyline background. This 21-slide presentation package includes everything you need for impactful business presentations, from a bold full-screen cover slide to data-rich diagram and chart slides. The cover slide places large white typography over a nighttime cityscape for a strong first impression, while content slides use a clean white two-column grid layout for maximum readability. The template includes an S-curve arrow flow diagram, a 5-step wave icon infographic, a percentage comparison infographic with figure illustrations, a column bar chart, and a line chart with data table. Whether you're preparing a strategy deck, business report, or investor pitch, this PowerPoint slide set delivers both visual impact and data clarity. Fully editable PPTX format allows you to customize text, colors, and images to match your brand.
Usage Points
-
Main Usage
Designed for high-stakes business presentations including strategy reviews, project proposals, investor pitches, and annual reports where both visual impact and data clarity are essential.
-
How to Use
Open the PPTX file and replace the cover title and subtitle with your own content. Input your data into the pre-built chart and diagram slides, and swap the city night background image with any photo that fits your brand.
-
Recommended For
Ideal for corporate strategists, business development managers, startup founders, and consultants who need to present vision and data together. Also well-suited for investor relations and board-level presentations.
-
Slide Structure
21 slides including a full-screen city night cover, S-curve arrow flow diagram, 5-step wave icon infographic, percentage comparison infographic with figure illustrations, column bar chart, and line chart with data table.
Related Products
-

Illustrated Folder Presentation Template – Stylish and Practical Design
#Business
-

Business Partnership PowerPoint Template – Build Trust with Elegant Design
#Business
-

Ideas Conference Presentation Template – Stylish Business Design
#Business
-

Fountain Pen Theme Presentation – Elegant Business Slide Design
#Business
