User Gender Ratio Analysis Chart – Statistical Insights and Strategic Use
RJ0300057_11
- Last Update 05/03/2025
- File Size 3.5MB
- # of Slides 2
- File Format PPTX
- Slide Ratio 16:9
- Color
Keywords
About the Product
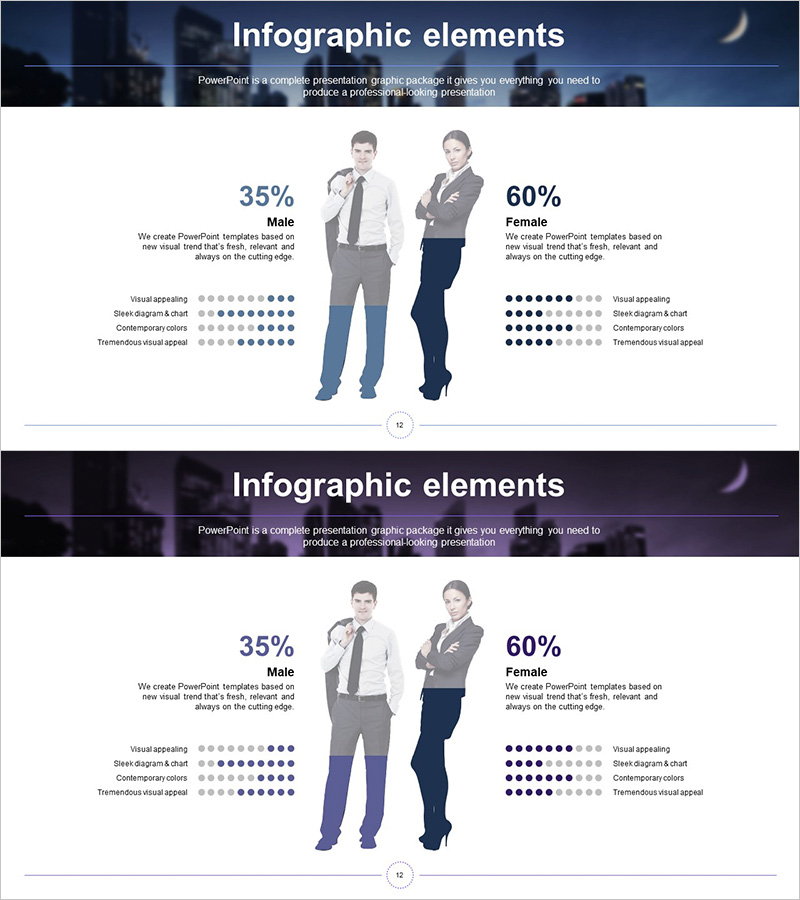
A professional infographic PowerPoint slide set for visualizing user gender ratio analysis. Featuring two layout variations that display male 35% and female 60% proportions using silhouette illustrations paired with percentage values. This presentation template includes visual appeal assessment, slide composition guidelines, contemporary color schemes, and trend-focused visual elements suitable for immediate use in customer analysis, market research, and demographic reporting. Provided in 16:9 aspect ratio PPTX format with fully editable text and numerical data fields.
Usage Points
-
Main Usage
This infographic is designed to present user or customer gender distribution ratios at a glance. By combining silhouette illustrations with percentage values, it conveys both qualitative and quantitative information simultaneously, providing credible data visualization across diverse business contexts including market research, customer segmentation analysis, and demographic reporting.
-
How to Use
Apply this template to customer analysis sections in company profiles, audience demographic breakdowns in marketing plans, market research findings in business proposals, or organizational composition reports in HR presentations. Choose between the two provided layout options or customize colors and figures to match your specific data requirements.
-
Recommended For
Marketing professionals, HR and organizational managers, market research specialists, executive report writers, and educational institution statisticians who need to clearly communicate gender distribution among users or organizational members. Particularly effective for diversity and inclusion initiatives or customer segmentation presentations.
-
Slide Structure
Two-slide set with symmetrical layout: male silhouette on the left (35% indicator) and female silhouette on the right (60% indicator). Bottom section displays evaluation metrics as dot indicators covering visual appeal, slide composition, contemporary colors, and trend-focused visual elements. Available in two background versions: dark tone and light tone for flexible design integration.
Related Products
-

User Analysis Pictogram Graph – Visualizing Customer Success
#Market and Competitor Analysis #Customer Success Stories #Graph
-

Human Details Infographic Chart – Customer Analysis and Market Overview
#Market and Competitor Analysis #Graph #Other
-

Customer Analysis Diagram & Segmentation Graph – In-depth Market Insights
#Market and Competitor Analysis #Graph #Customer Analysis
-

Premium Management Presentation Map Analysis3 - Customer Insights and Market Analysis
#Market and Competitor Analysis #Graph #Other
