Business Process Connection Diagram - Visual Guidance for Business Processes
RJ0300057_7
- Last Update 05/03/2025
- File Size 3.1MB
- # of Slides 2
- File Format PPTX
- Slide Ratio 16:9
- Color
Keywords
- #Content-Based Slides
- #Design-Based Slides
- #Business Strategy
- #Operational Plan
- #Diagram
- #Step-by-Step Schedule Plan
- #Business Processes
- #Cluster
- #Chain Diagram
- #16:9
- #arrow diagram PowerPoint
- #process flow presentation
- #connection diagram slide
- #business process PPT
- #step-by-step flowchart PowerPoint
About the Product
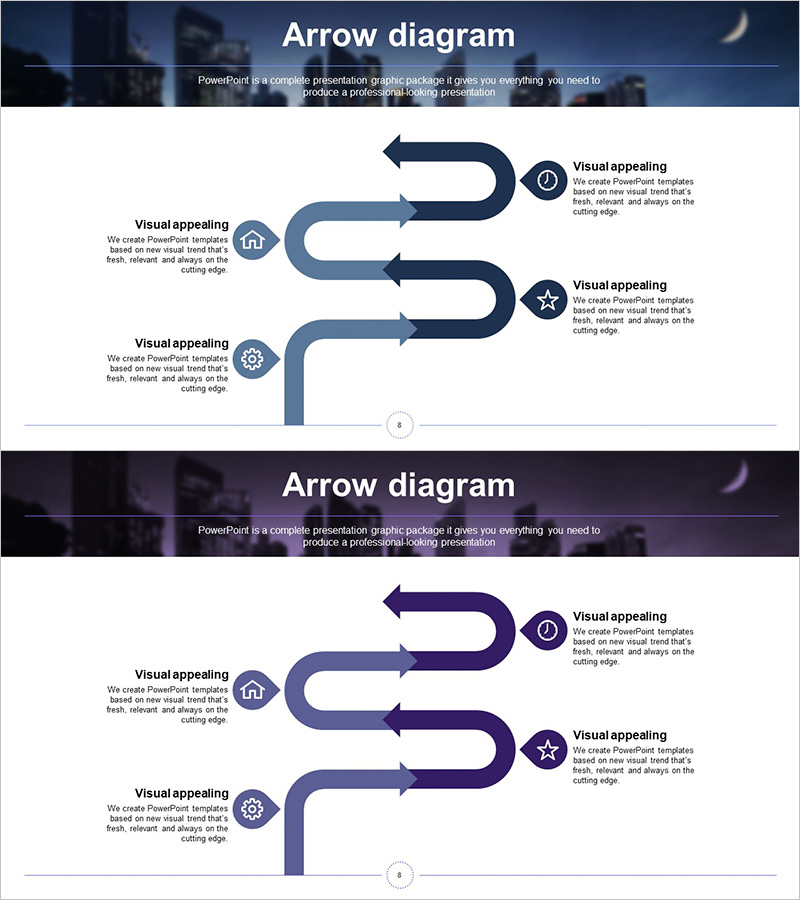
A PowerPoint slide featuring an arrow connection diagram that visualizes business processes and workflow stages. The design connects left-side icons to right-side circular nodes through a three-step flow structure, allowing text descriptions for each stage. Gradient arrows in dark blue, light blue, and purple tones emphasize process connectivity and directional flow. This presentation slide is ready to use for business strategy presentations, workflow documentation, phased execution plans, and organizational process improvements.
Usage Points
-
Main Usage
Illustrates business processes and workflow stages through arrow connectors and circular nodes, making complex procedures intuitive and easy to understand. The left-to-right linear flow structure clearly communicates cause-and-effect relationships and process dependencies.
-
How to Use
Insert icons or labels into each circular node and add stage descriptions, objectives, or responsibilities in the text areas on the right. Customize arrow colors to indicate priority levels or importance, and adjust the slide background to match your presentation theme and corporate branding.
-
Recommended For
Ideal for business strategy presentations, process improvement initiatives, project execution plans, organizational change management, and quality enhancement programs. Suitable for executives, project managers, business analysts, and operations professionals presenting workflow improvements and process optimization.
-
Slide Structure
Two-slide set. Each slide features three left-side icons (house, circular icon, gear) connected to three right-side circular nodes via gradient arrows. Text input areas are positioned on the right of each node, with dark blue, light blue, and purple gradient arrows directing the flow sequence.
Related Products
-

Visualizing Daily Work Processes – Effective Operational Planning
#Business Strategy #Operational Plan #Diagram
-

Cascading Bubble Flow Slide – Business Strategy and Operations Planning
#Business Strategy #Operational Plan #Diagram
-

Visualizing the IoT Service Process – Incorporating Business Strategy
#Business Strategy #Operational Plan #Diagram
-

Game Business Process Diagram - Visualization of Business Strategy
#Business Strategy #Operational Plan #Diagram
