Dawn City Theme Competitor Analysis Graph – Understanding Market Trends
RJ0300057_17
- Last Update 05/03/2025
- File Size 3.4MB
- # of Slides 2
- File Format PPTX
- Slide Ratio 16:9
- Color
Keywords
- #Content-Based Slides
- #Design-Based Slides
- #Market and Competitor Analysis
- #Diagram
- #Graph
- #Competitor Analysis
- #Competitive Advantage
- #Table
- #Line
- #Standard Table
- #Line Chart
- #16:9
- #line chart PowerPoint slide
- #dual-series data visualization
- #market trend analysis template
- #competitor comparison slide
- #time series chart download
About the Product
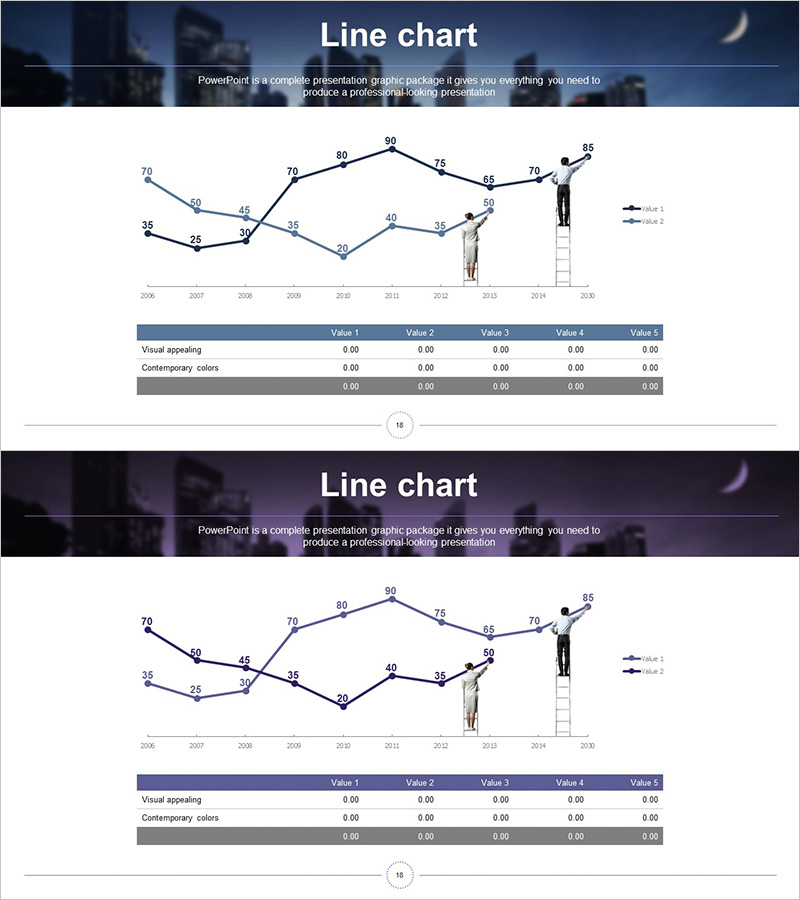
A dual-series line chart PowerPoint slide with a dawn city theme for comparing business metrics over time. This presentation slide visualizes data from 2006 to 2015 across two distinct data series, making it ideal for competitor analysis, sales trends, customer satisfaction tracking, and market performance evaluation. The 16:9 widescreen PPTX format allows direct editing of data values for immediate use. Perfect for business presentations, quarterly reviews, and strategic planning sessions where trend visualization is essential.
Usage Points
-
Main Usage
Compare two or more data series across time periods to identify trends, patterns, and performance gaps. Ideal for presenting competitor benchmarking, quarterly sales performance, market share evolution, customer satisfaction trends, and strategic KPI tracking in executive presentations.
-
How to Use
Edit the data table at the bottom by entering your values in the Value 1 through Value 5 columns. The line chart automatically updates to reflect your data. Customize axis labels, legend text, and color scheme to match your presentation theme and analysis context.
-
Recommended For
Marketing managers, sales directors, financial analysts, business consultants, market researchers, and executives preparing competitive analysis reports, performance reviews, and strategic planning presentations.
-
Slide Structure
Comprises a dual-line chart with two data series (Value 1 and Value 2) plotted against 10 time points (2006-2015) on the X-axis and numerical values (0-90 range) on the Y-axis. Each series uses distinct colors with data point labels. Supporting data table below displays all values for reference and editing.
Related Products
-

Competitor Analysis Graph & Table by Year
#Market and Competitor Analysis #Diagram #Graph
-

Visualizing Market Analysis with Line Chart – Harmony of Mint and Orange
#Market and Competitor Analysis #Diagram #Graph
-

Comparison Graph of Yearly Trends – Market and Competitor Analysis
#Market and Competitor Analysis #Diagram #Graph
-

Competitor Comparison Graph & Table - Essential Tool for Market Analysis
#Market and Competitor Analysis #Diagram #Competitor Analysis
