Business Analysis with Doughnut Chart – Dawn City Theme
RJ0300057_14
- Last Update 05/03/2025
- File Size 3.4MB
- # of Slides 2
- File Format PPTX
- Slide Ratio 16:9
- Color
Keywords
- #Content-Based Slides
- #Design-Based Slides
- #Product/Service Introduction
- #Business Introduction
- #Diagram
- #Graph
- #Development Status
- #Technological Status
- #Cluster
- #Circles
- #Chain Diagram
- #Doughnut Chart
- #16:9
- #doughnut chart PowerPoint
- #pie chart slide template
- #business analysis presentation
- #data visualization template
- #donut chart download
About the Product
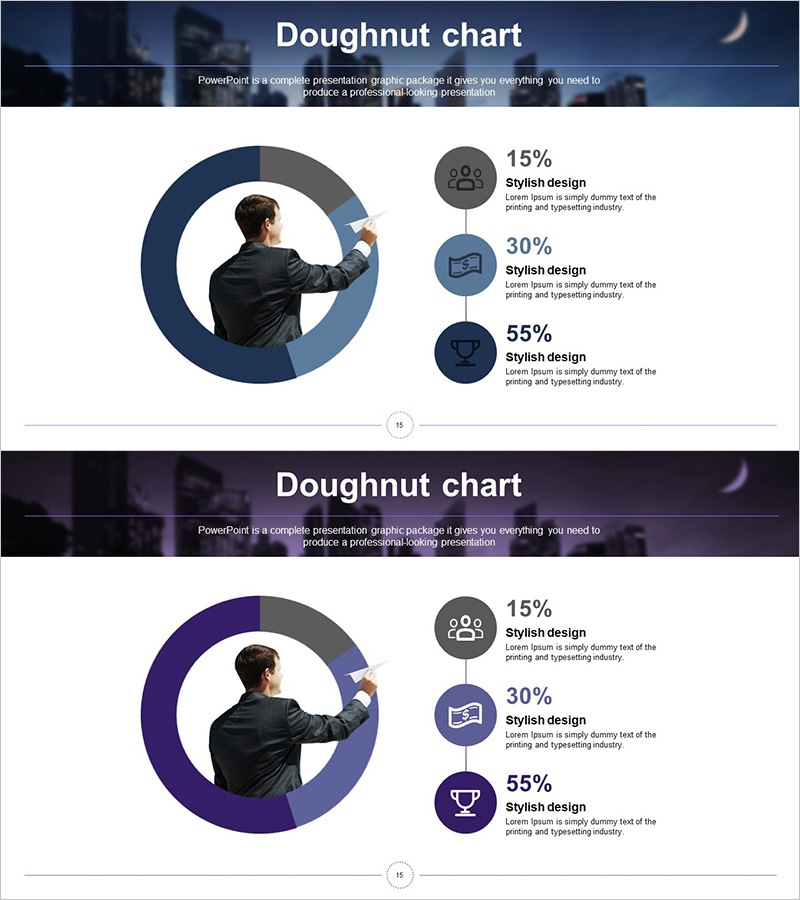
A professional doughnut chart PowerPoint slide optimized for business analysis and data visualization. Features a striking dark blue-to-purple gradient color scheme with a central image area, clearly expressing the proportion of three data segments. Each section includes an icon and percentage value for enhanced information clarity. Delivered as a 16:9 widescreen PPTX file with 2 fully editable slides. Perfect for presenting marketing performance metrics, customer satisfaction surveys, departmental contribution analysis, and other ratio-based business insights.
Usage Points
-
Main Usage
Visually compare and analyze the proportional relationship between three data categories. The central donut area can highlight a key message, company logo, or icon, while percentage values in each segment provide quantitative credibility. Ideal for marketing performance, customer satisfaction metrics, departmental contribution, and market share analysis.
-
How to Use
Open the slide and replace the percentage values and icons with your own data. Insert a company logo, product image, or key message in the center donut area to maximize visual impact. The gradient color scheme is pre-applied and can be adjusted via the color palette if needed. Use both slides to present multiple datasets or comparative analysis.
-
Recommended For
Marketing managers, sales directors, financial analysts, and executives preparing performance reports. Effective for quarterly performance reviews, customer segmentation strategies, product portfolio composition, and budget allocation presentations. Widely used in consulting firms, financial institutions, and manufacturing companies for executive meetings and shareholder presentations.
-
Slide Structure
2 slides with a centered doughnut chart and right-aligned legend area. The donut is divided into 3 segments in distinct colors (dark blue, mid-tone, purple). The right side displays icons, percentages, and descriptive text in vertical alignment. Header and footer areas accommodate titles and additional information.
Related Products
-

Business Plan Presentation Template Pie Diagram – Effective Project Introduction
#Product/Service Introduction #Business Introduction #Graph
-

Four Color Infographic – Business Status Presentation
#Product/Service Introduction #Business Introduction #Graph
-

Progress Status Order Circle Graph – Visualizing Project Progress
#Product/Service Introduction #Business Introduction #Diagram
-

Big Data Development Status Analysis Graph – Visualizing Business Strategy
#Product/Service Introduction #Business Introduction #Diagram
