Analysis of Social Media Cloud Development Status – Stylish Donut Chart
RJ0400070_13
- Last Update 06/06/2025
- File Size 0.7MB
- # of Slides 2
- File Format PPTX
- Slide Ratio 16:9
- Color
Keywords
- #Content-Based Slides
- #Design-Based Slides
- #Product/Service Introduction
- #Business Introduction
- #Graph
- #Other
- #Development Status
- #Technological Status
- #Circles
- #Doughnut Chart
- #16:9
- #donut chart PowerPoint slide
- #pie chart presentation template
- #ratio visualization PPT
- #data visualization slides
- #circular graph download
About the Product
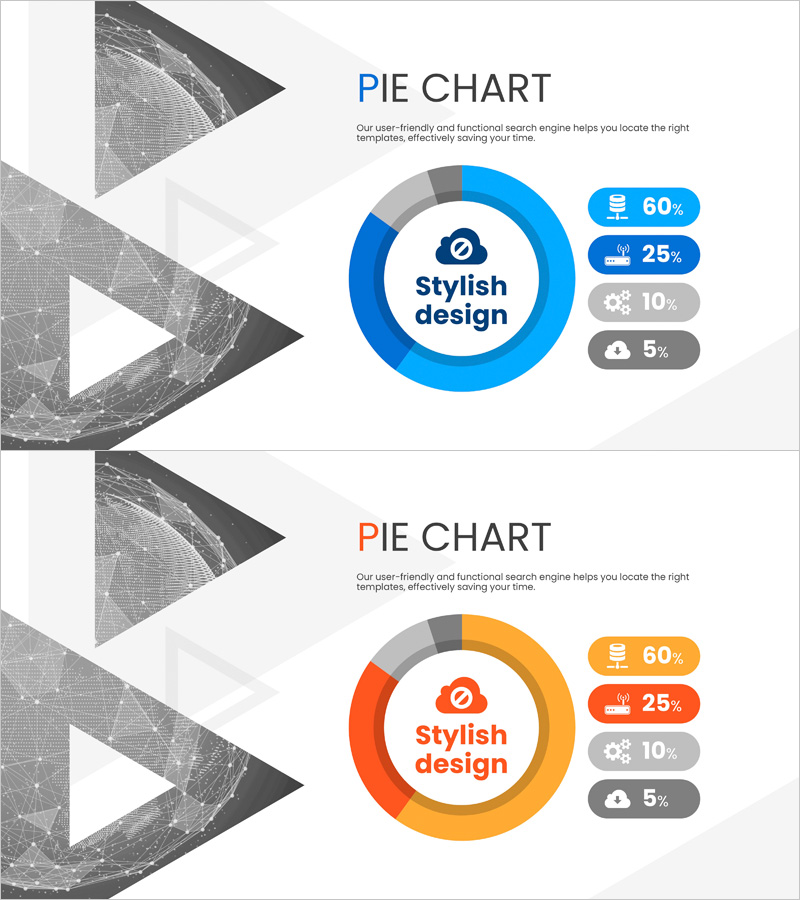
A donut chart PowerPoint slide designed to visually analyze social media and cloud development status with a 4-segment ratio structure. The center area highlights your core message while surrounding segments display percentage data for each category, making it ideal for data-driven presentations. Created in blue and orange dual-tone colors, this slide template suits technology, marketing, and analytical reports. The 2-slide set allows you to present multiple ratio datasets, and the 16:9 widescreen PPTX format ensures compatibility across all presentation environments.
Usage Points
-
Main Usage
Visualize 4-category composition ratios such as social media platform distribution, market share, customer satisfaction levels, or technology stack percentages. The center message zone emphasizes your topic while the four surrounding segments intuitively convey each item's percentage contribution.
-
How to Use
Insert into technology reports, marketing analysis presentations, or business status updates where ratio-based data visualization is needed. Edit segment colors and percentages to match your actual data, and customize the center text to apply the template across different topics and industries.
-
Recommended For
IT and cloud companies presenting technical status reports, social media marketing teams analyzing channel performance, data analysts presenting statistical findings, executives delivering quarterly performance reviews, and consulting firms presenting market analysis insights.
-
Slide Structure
2-slide set featuring a blue-tone donut chart on the first slide and an orange-tone donut chart on the second, both with identical structure: center circular area plus 4 outer segments. Right side displays 4 data items with icons, percentages, and labels for enhanced readability and professional appearance.
Related Products
-

Financial Management Analysis Status Graph
#Product/Service Introduction #Business Introduction #Graph
-

Technology Achievement Donut Chart
#Product/Service Introduction #Business Introduction #Graph
-

Mobile App Service Development Status – Doughnut Chart Visualization
#Product/Service Introduction #Business Introduction #Graph
-

Social Network Target Market Analysis – Insights and Strategies
#Product/Service Introduction #Market and Competitor Analysis #Graph
