Status of Parts Production and Development – Donut Chart Infographic
RJ0600038_11
- Last Update 07/01/2025
- File Size 0.3MB
- # of Slides 2
- File Format PPTX
- Slide Ratio 16:9
- Color
Keywords
- #Content-Based Slides
- #Design-Based Slides
- #Product/Service Introduction
- #Business Introduction
- #Graph
- #Development Status
- #Technological Status
- #Circles
- #Doughnut Chart
- #16:9
- #donut chart PowerPoint slide
- #pie chart presentation template
- #data visualization PPT
- #ratio chart design
- #circular graph slide template
About the Product
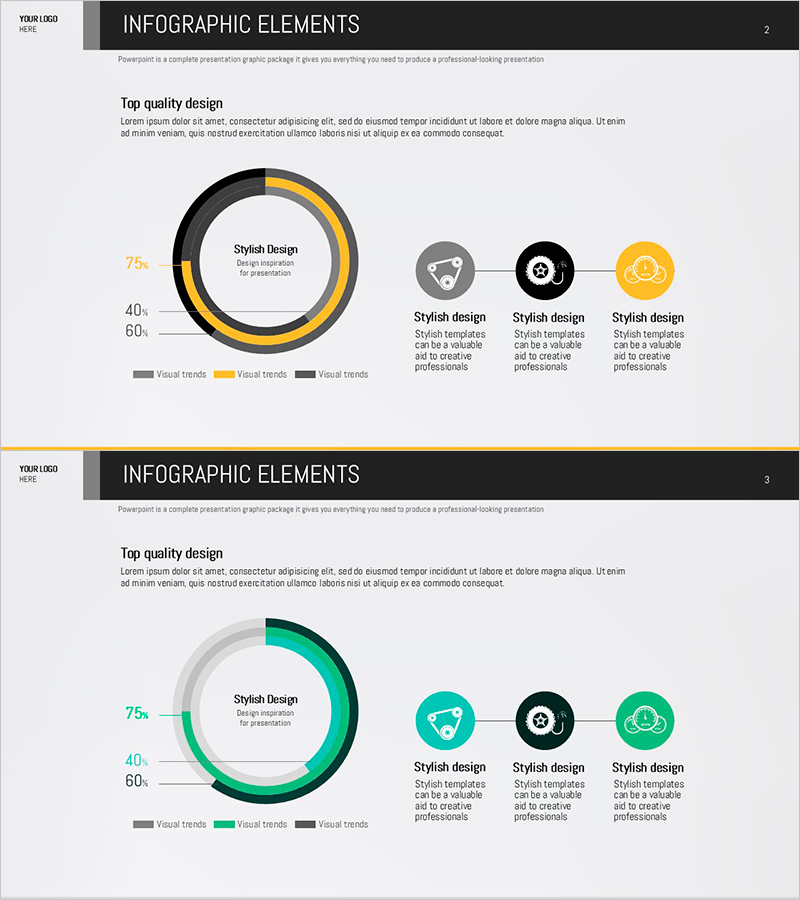
A PowerPoint slide featuring a donut chart to visualize parts production and development status. The concentric circle structure displays three data series in black, gold, and gray tones, with a central text area for highlighting key metrics. Left-side percentage labels and three right-side icons provide intuitive data interpretation. Available in 16:9 PPTX format, fully editable and ready for manufacturing, technical, and strategic presentations.
Usage Points
-
Main Usage
Designed for manufacturing and technical presentations to display multi-layered data such as production status, development phase progress, and resource allocation ratios simultaneously. The donut structure's central area focuses audience attention on key figures, while left-side percentages and right-side icons reinforce each category's meaning.
-
How to Use
The template includes 2 slides with different color schemes: the first features black, gold, and gray tones; the second uses teal, black, and green. Simply update the percentage values and icons to match your data. Select the color scheme that aligns with your corporate brand or presentation theme.
-
Recommended For
Ideal for manufacturing production reports, quarterly performance presentations to executives, investor briefings on project progress, and resource allocation updates for project teams. Particularly effective when comparing multiple categories' proportions simultaneously.
-
Slide Structure
Each slide comprises a central donut chart with three concentric rings, left-side percentage indicators (75%, 40%, 60%), and three icon areas on the right. Title and description text spaces at top and bottom allow flexible customization for your presentation context.
Related Products
-

Exercise Objectives Achieved Diagram & Chart – Post-Progress
#Product/Service Introduction #Business Introduction #Diagram
-

Business Plan Presentation Template Pie Diagram – Effective Project Introduction
#Product/Service Introduction #Business Introduction #Graph
-

Four Color Infographic – Business Status Presentation
#Product/Service Introduction #Business Introduction #Graph
-

Analysis of Social Media Cloud Development Status – Stylish Donut Chart
#Product/Service Introduction #Business Introduction #Graph
