Visualizing Military Data with Donut Chart – Power of Trust
RJ0600056_28
- Last Update 07/05/2025
- File Size 2.6MB
- # of Slides 2
- File Format PPTX
- Slide Ratio 16:9
- Color
Keywords
- #Content-Based Slides
- #Design-Based Slides
- #Product/Service Introduction
- #Business Introduction
- #Diagram
- #Graph
- #Development Status
- #Technological Status
- #Spread
- #Circles
- #Centralized Diagram
- #Doughnut Chart
- #16:9
- #donut chart PowerPoint
- #pie chart presentation slide
- #data ratio visualization
- #donut graph template
- #3-segment chart design
About the Product
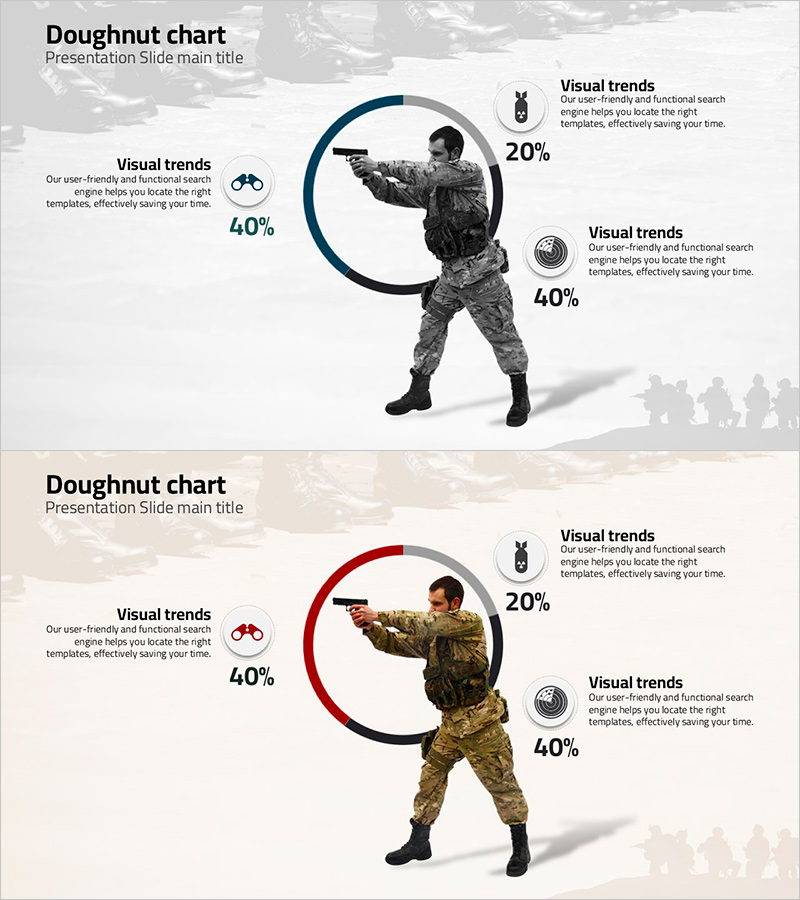
A donut chart PowerPoint slide that divides military, security, and organizational data into three segments to express proportional relationships. The design combines dark blue, red, and gray color schemes to emphasize trust and authority, enhanced by silhouette imagery and percentage labels for maximum information clarity. The 2-slide set provides color-variant layouts of the same design, allowing consistent representation of multiple datasets. Delivered in 16:9 widescreen PPTX format with full editability, ideal for reports, proposals, and executive presentations.
Usage Points
-
Main Usage
Optimized for expressing part-to-whole ratios such as organizational structure, budget allocation, market share, and resource distribution. The hollow center of the donut allows placement of key metrics or titles to strengthen information hierarchy.
-
How to Use
Edit the donut chart segments and percentages in the slide master to match your data. Adjust silhouette image positioning and text boxes to fit your presentation context while maintaining visual consistency with the background map pattern.
-
Recommended For
Ideal for executives, analysts, and project managers presenting policy decisions, budget reviews, and performance analyses. Particularly effective in security, defense, and organizational management sectors where trust and authority are essential.
-
Slide Structure
2-slide set. Each slide features a 3-segment donut chart (40%-40%-20% ratio), left-aligned silhouette image, and three right-aligned text boxes (each labeled 20%). First slide emphasizes dark blue; second slide uses red accent color variation.
Related Products
-

Cat Donut Chart – Data Analysis and Creativity
#Product/Service Introduction #Business Introduction #Diagram
-

Business Project Development Status Analysis Graph
#Product/Service Introduction #Business Introduction #Graph
-

Four Color Infographic – Business Status Presentation
#Product/Service Introduction #Business Introduction #Graph
-

Technology Achievement Donut Chart
#Product/Service Introduction #Business Introduction #Graph
