Business/Performance Report Template – Professional and Sleek Design
M0800001
- Last Update 07/26/2025
- File Size 68.5MB
- # of Slides 19
- File Format PPTX
- Slide Ratio 16:9
- Color
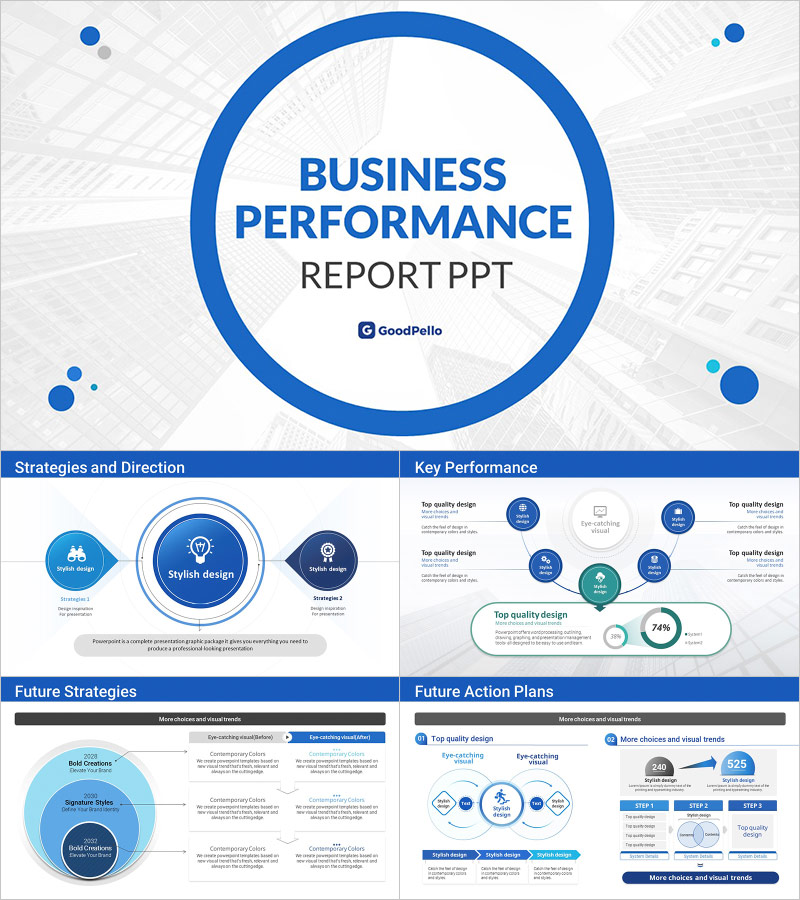
Slide Preview


Keywords
About the Product
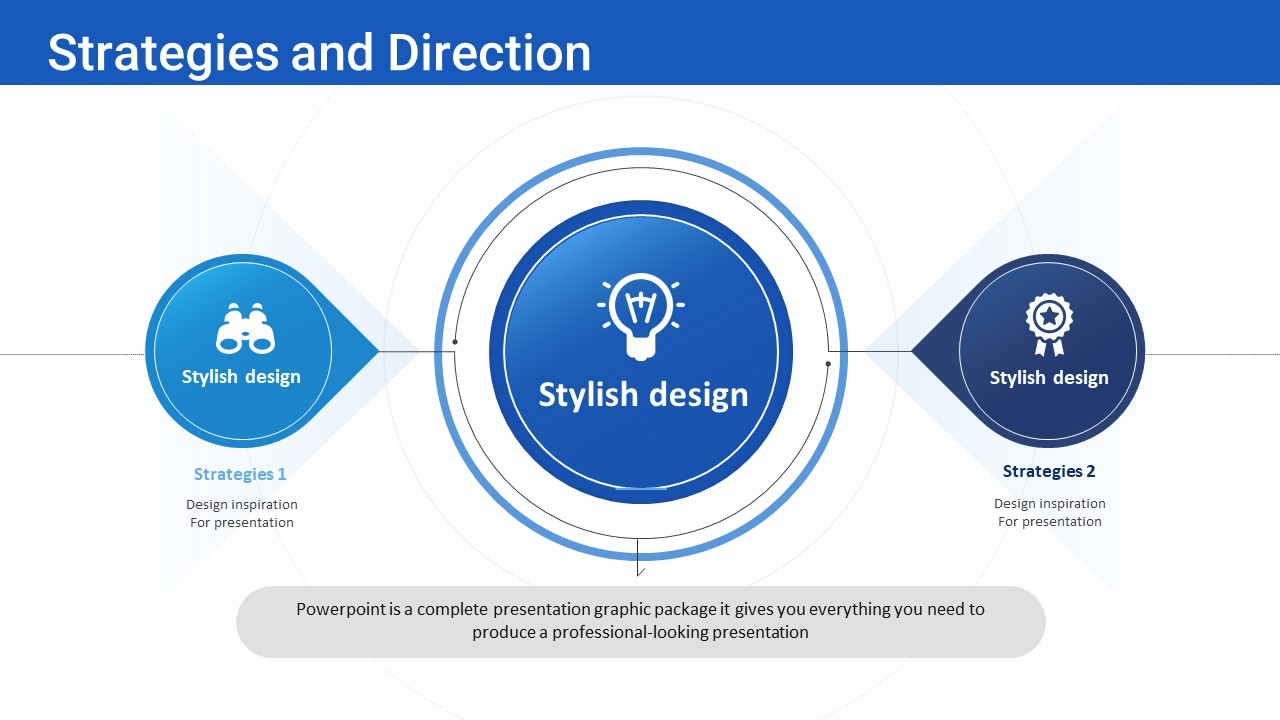
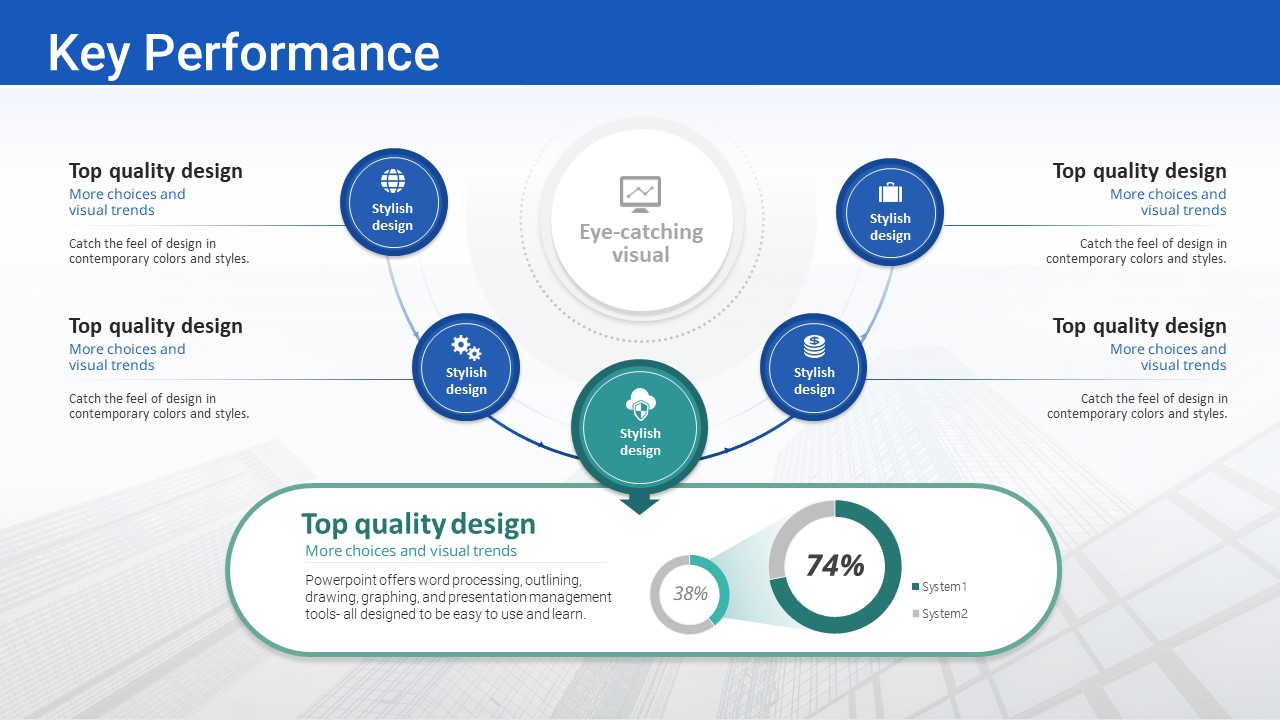
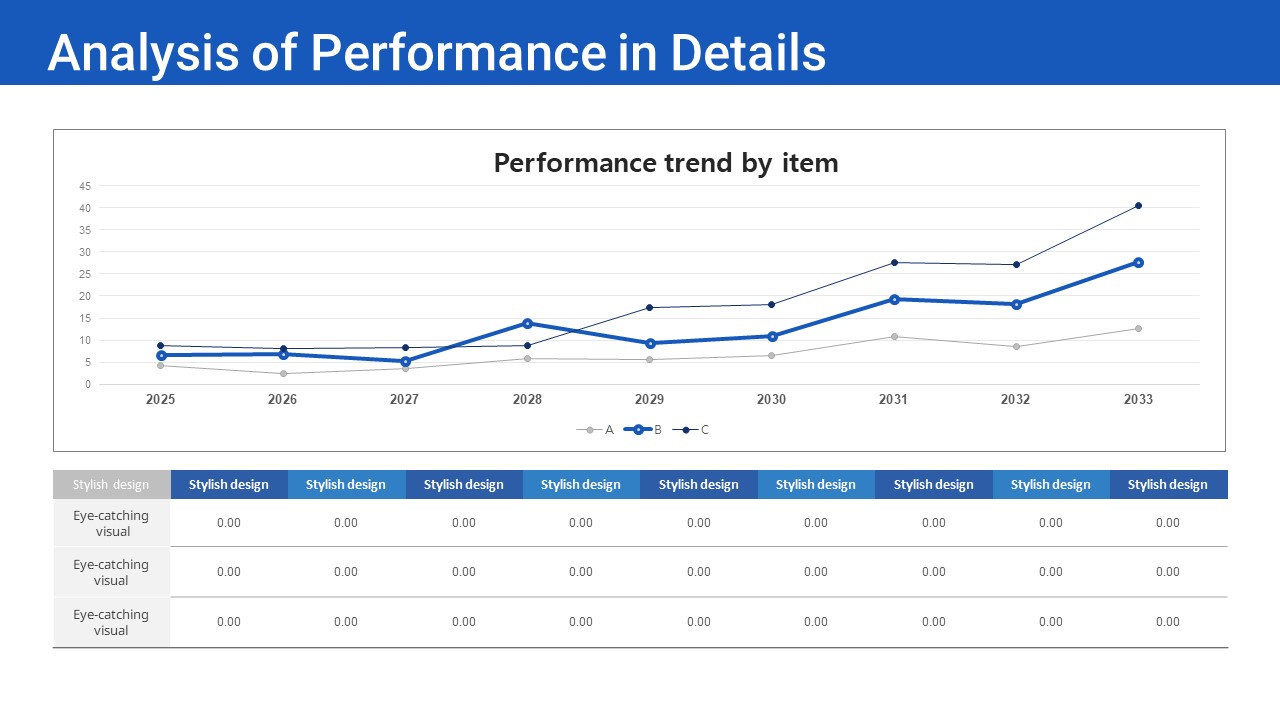
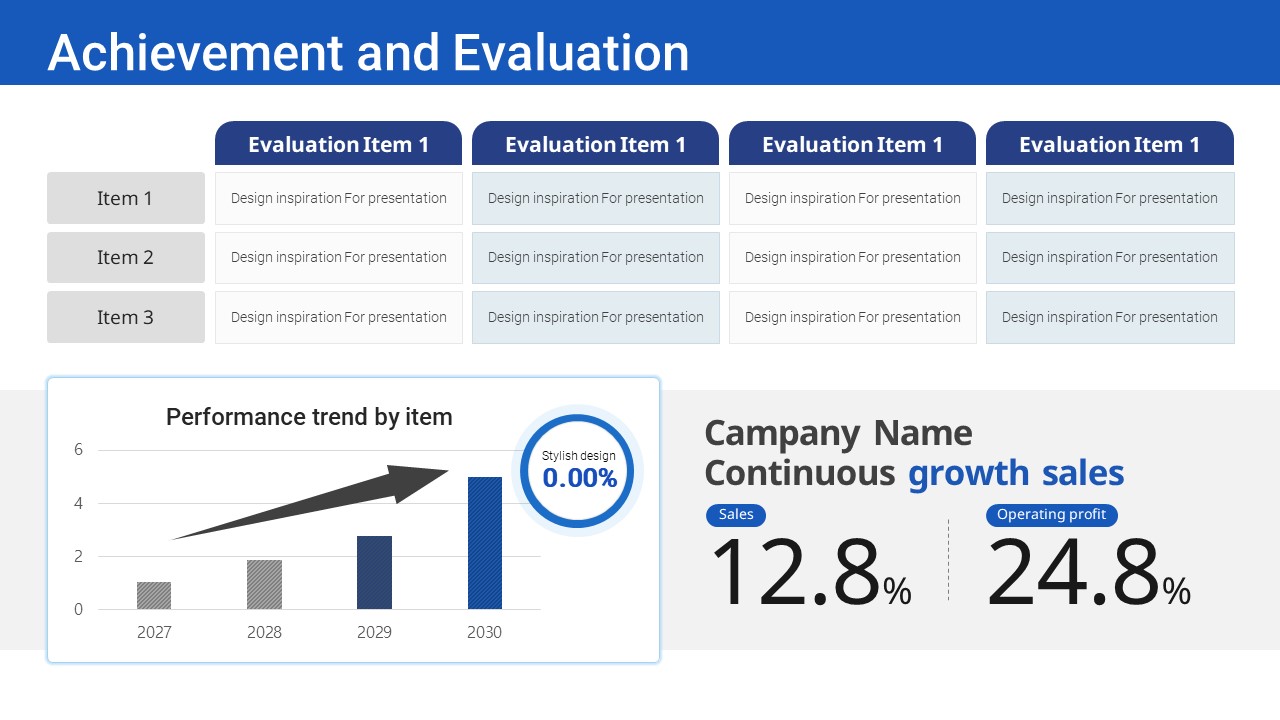
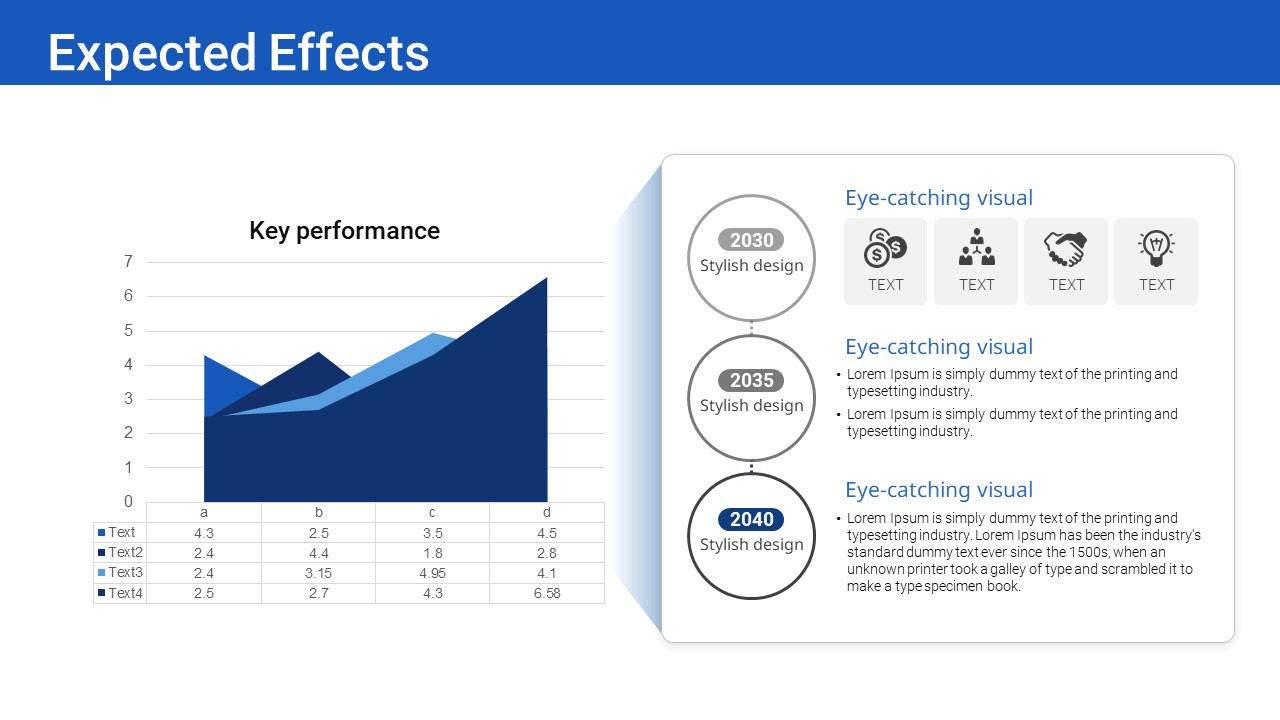
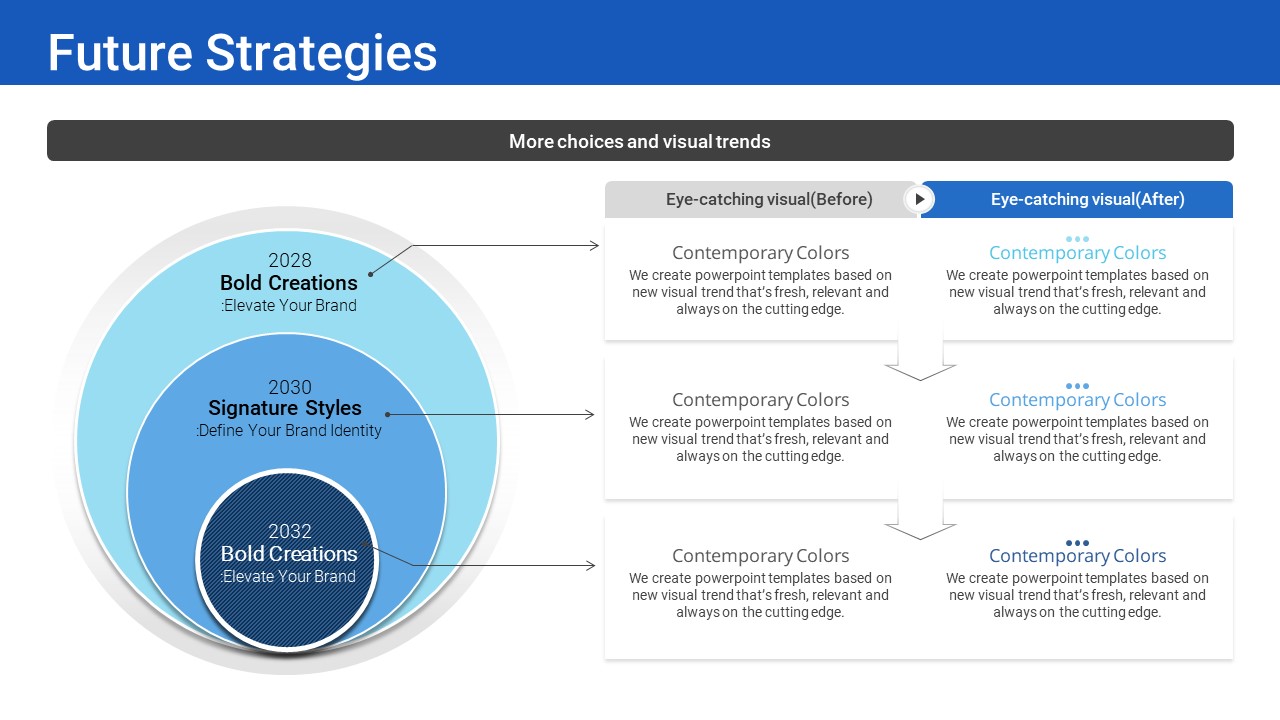
This PowerPoint template is a 19-slide professional presentation designed to report business strategies and performance results in a structured, visually compelling format. Built on a royal blue, white, and light gray color scheme, it delivers a trustworthy corporate tone suitable for executive briefings and investor presentations. The deck covers the full reporting arc: strategic direction, key performance indicators, detailed performance analysis, achievement evaluation, and future action plans. Visual elements include bubble diagrams for strategy positioning, radial cluster charts for KPI overviews, timelines with Venn diagrams for future strategies, evaluation matrices, and mixed bar-line charts for performance trends. Each slide is fully editable in PowerPoint, allowing teams to replace placeholder content and present immediately. Whether you need a quarterly business review, an annual performance report, or a board-level strategy update, this slide deck provides the structure and visual clarity to communicate results with confidence.
Usage Points
-
Main Usage
Designed to present business strategies, key performance indicators, achievement evaluations, and future action plans in a single cohesive deck for executives, board members, and investors.
-
How to Use
Use the section divider slides as anchors to organize content into Strategy, Performance, Evaluation, and Action Plan segments. Replace the bubble diagram and radial cluster placeholders with your actual KPI data, and update the mixed chart with your performance trend figures.
-
Recommended For
Ideal for corporate strategy teams, business planning managers, IR professionals, startup founders, and CFOs who need to deliver structured performance reports to executives, boards, or investors.
-
Slide Structure
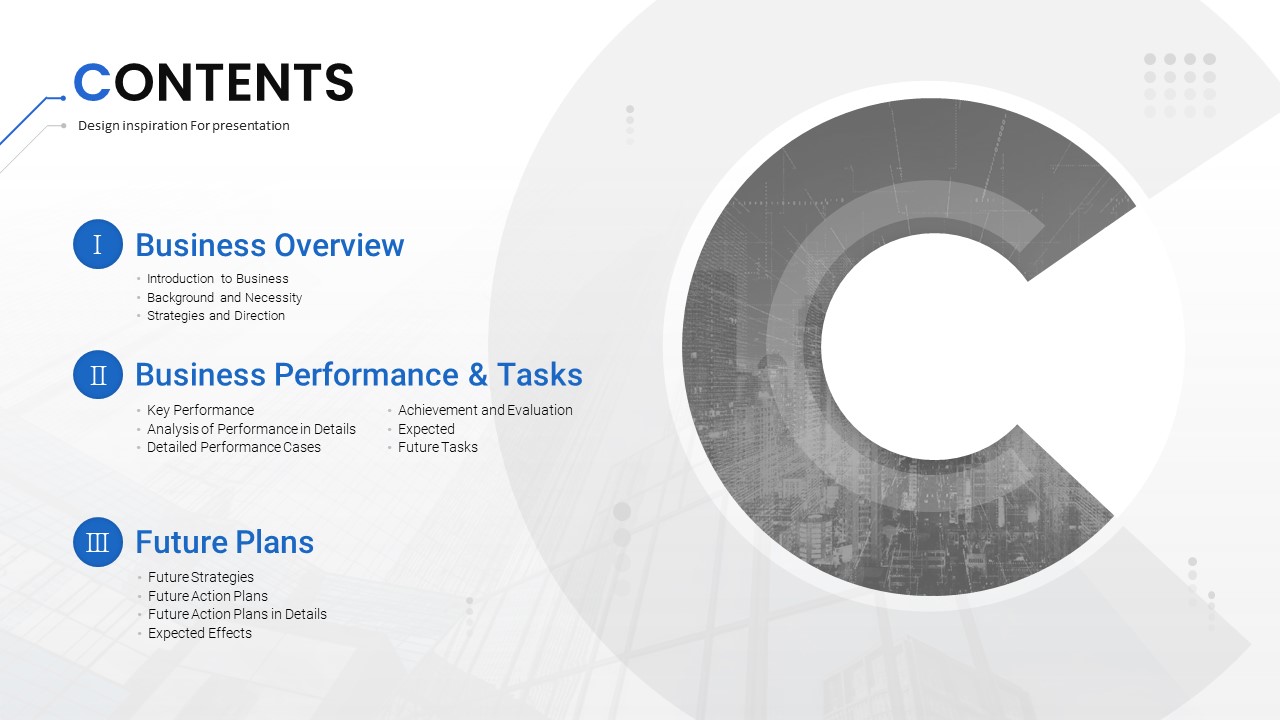
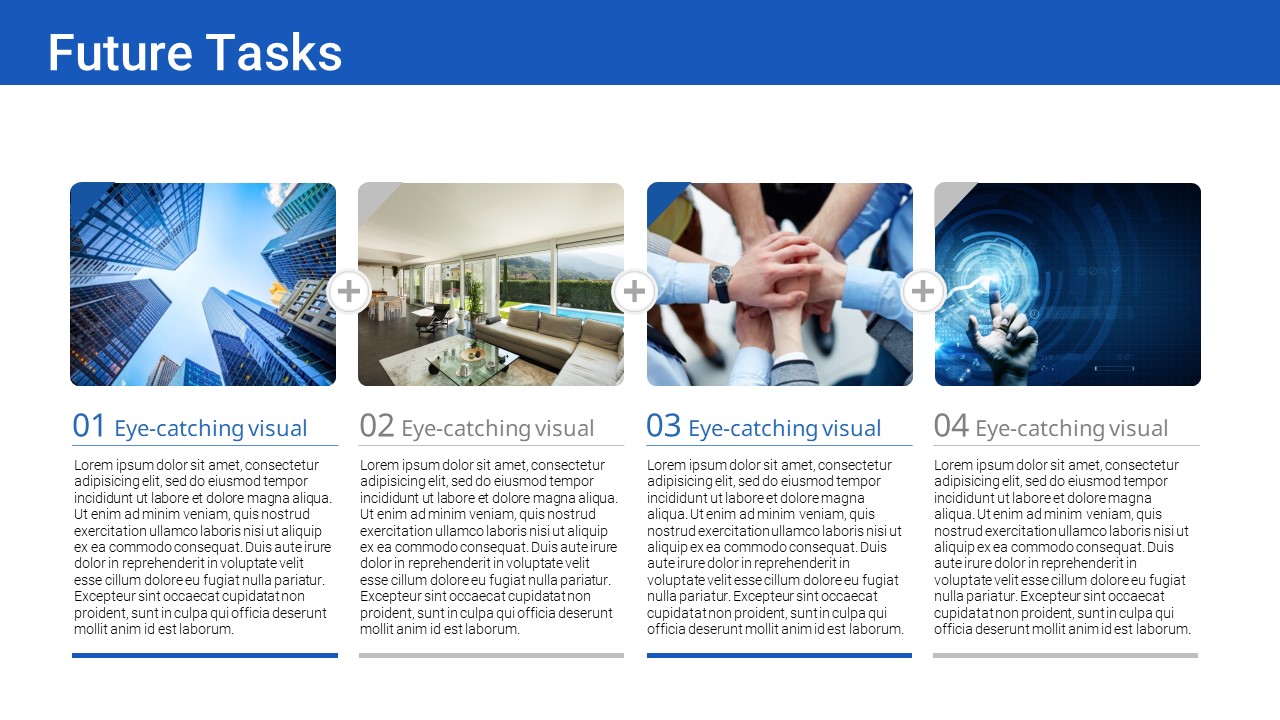
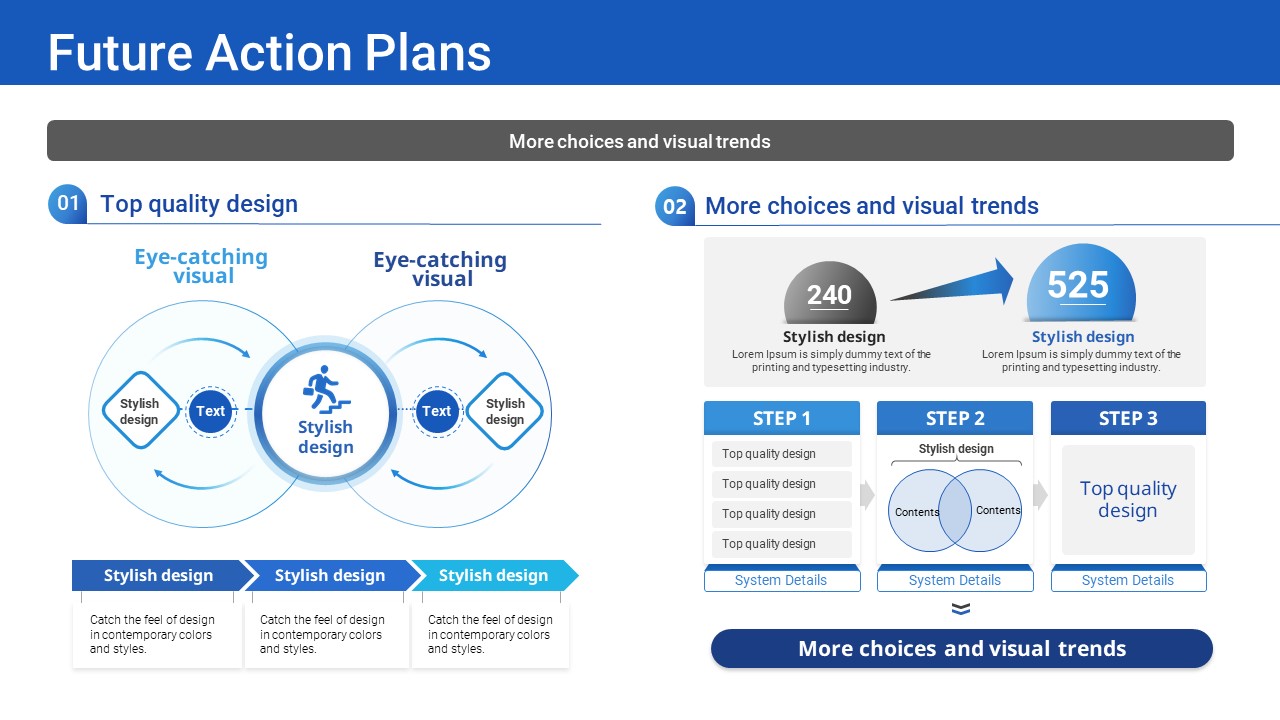
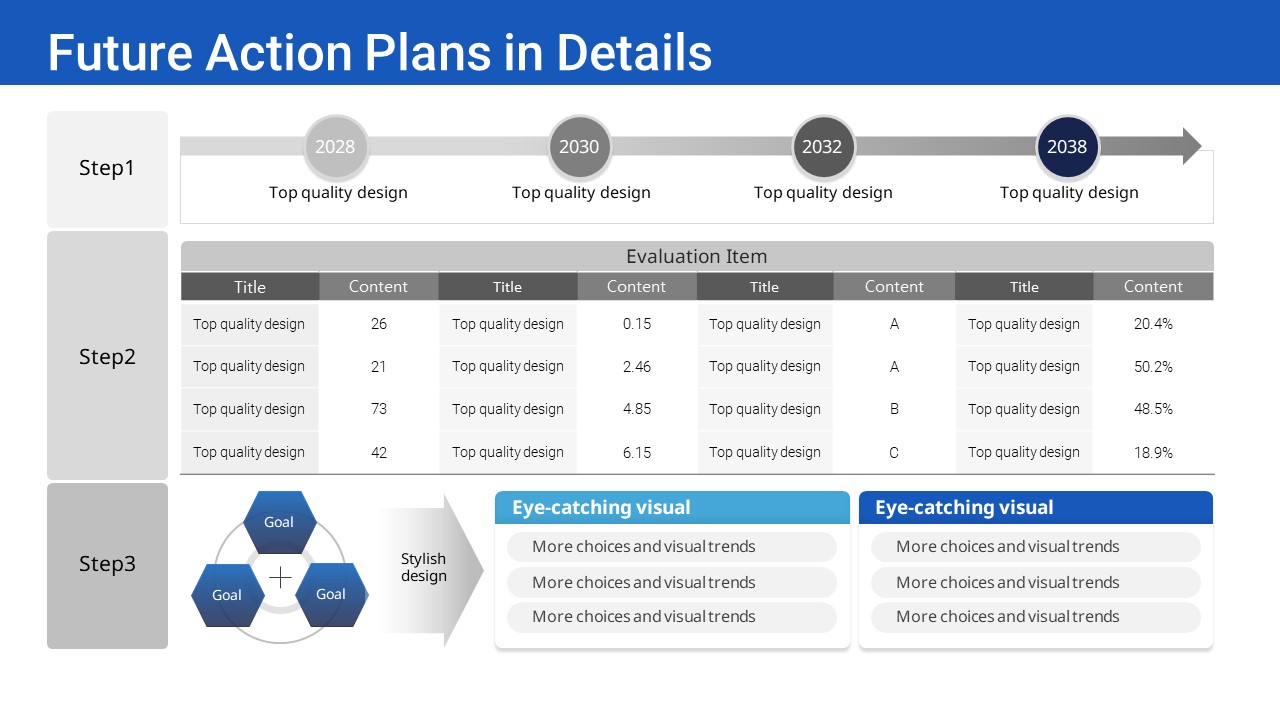
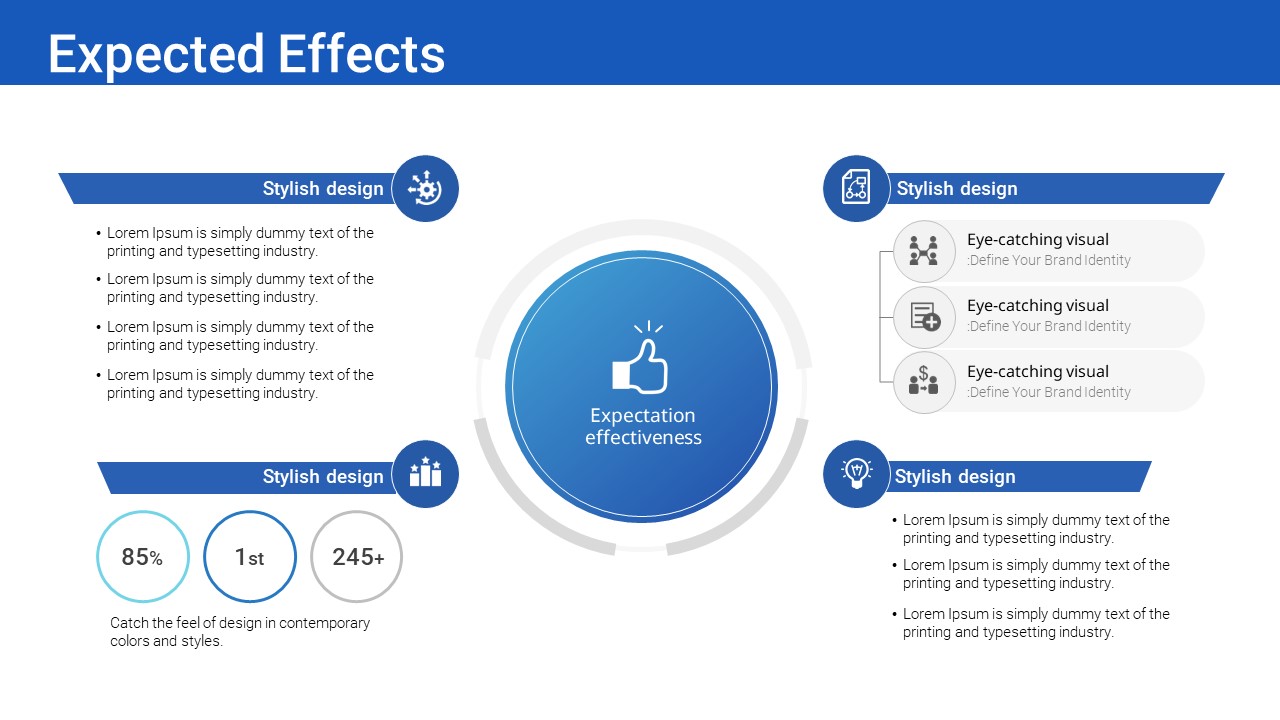
19 slides total: Cover → Section divider (photo + 2-column agenda) → Strategies and Direction (bubble diagram) → Key Performance (radial cluster + donut chart) → Future Strategies (timeline + Venn diagram) → Future Action Plans (roadmap + evaluation table + step boxes) → Achievement and Evaluation (matrix table + mixed bar-line chart) → Closing slide.
Related Products
-

Environmental Business Report Template – Modern and Stylish Design
#Business/Performance Report
-

Travel Business Illustration Report PowerPoint Template – Modern Design
#Business/Performance Report
-

Neumorphism Business Report PowerPoint Template – Stylish Design and Practical Layout
#Business/Performance Report
-

Bio Healthcare Business Report PowerPoint Template – Modern and Intuitive Design
#Business/Performance Report
