Company History & Business Status – Visualized with Linear Diagram
RM0800001_4
- Last Update 02/27/2025
- File Size 0.9MB
- # of Slides 2
- File Format PPTX
- Slide Ratio 16:9
- Color
Keywords
- #Content-Based Slides
- #Design-Based Slides
- #Company Introduction
- #Diagram
- #Company Overview
- #History
- #Flow
- #Structure
- #Linear Flow
- #Pyramid Chart
- #16:9
- #linear timeline diagram PowerPoint
- #company history slide template
- #business status flow chart
- #5-stage timeline PowerPoint
- #how to create timeline in PowerPoint
About the Product
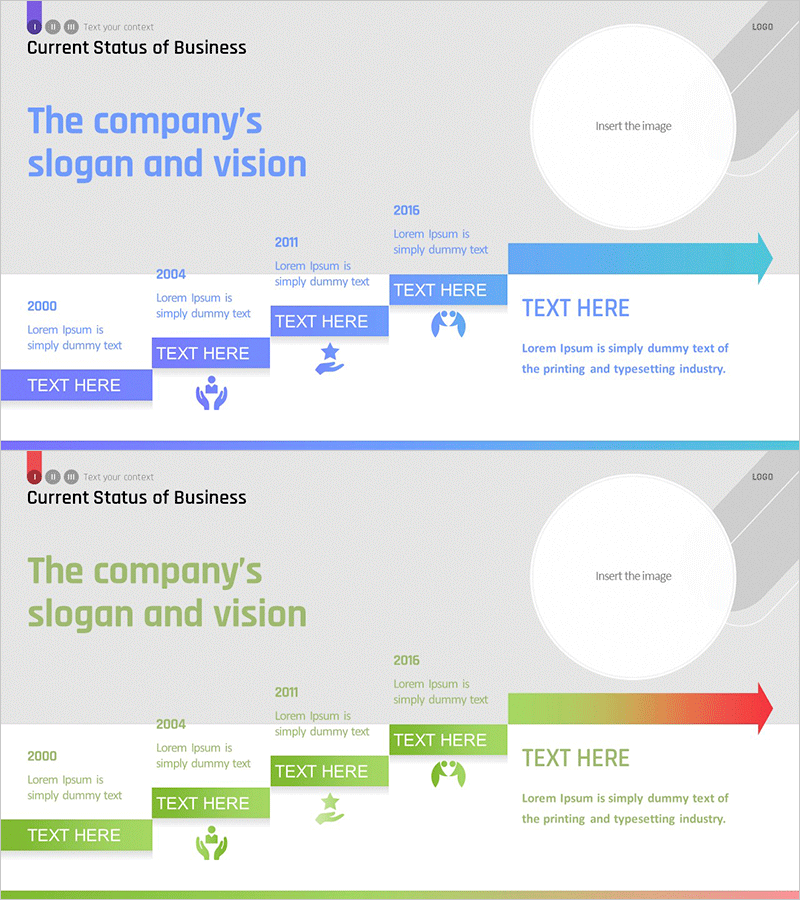
A PowerPoint slide set that visualizes company history and business status through a 5-stage linear timeline diagram. Featuring 2 slides in blue and green color schemes, each stage displays year, description text, and icon elements to illustrate corporate growth progression. The right side emphasizes current status with a blue arrow and circular image placeholder, creating an intuitive visual narrative. Ready-to-use for investor presentations, company introductions, and executive briefings without additional design work.
Usage Points
-
Main Usage
Presents corporate growth milestones and business evolution in chronological order, enabling audiences to understand company trajectory and current operations at a glance. Hierarchical information structure with year, description, and icons simplifies complex narratives into clear visual progression.
-
How to Use
Apply to investor pitches, company overview presentations, executive reports, and employee onboarding sessions. Replace timeline years and descriptions with your company data, swap icons with company logos or achievement images, and customize color scheme to match corporate branding for immediate deployment.
-
Recommended For
Executives, marketing teams, sales professionals, HR departments, and investor relations specialists presenting company background and business status. Particularly effective for startups, SMEs, and large enterprises introducing new business divisions while emphasizing growth narratives and strategic milestones.
-
Slide Structure
2-slide set with 5 chronological nodes (2000–2016) arranged linearly on the left side of each slide. Each node includes year label, descriptive text, and icon element. Right side features blue directional arrow and circular image placeholder highlighting current status. Both blue and green color variations provided for flexible brand alignment.
Related Products
-

Adventure Company History 4 Color Connection Diagram
#Company Introduction #Business Strategy #Diagram
-

History Vertical Arrow Diagram – Business Flow Visualization
#Company Introduction #Diagram #History
-

History Text Diagram – Business Growth Story
#Company Introduction #Diagram #Text Box
-

Three-dimensional Box Diagram – Visualization of Business Strategy
#Business Strategy #Diagram #Production Plan
