Service Configuration Diagram Visualized – A Cluster for High Understanding
RM0800001_13
- Last Update 02/27/2025
- File Size 1.3MB
- # of Slides 2
- File Format PPTX
- Slide Ratio 16:9
- Color
Keywords
- #Content-Based Slides
- #Design-Based Slides
- #Technical Approach
- #Diagram
- #Service Architecture Diagram
- #Implementation Case Studies
- #Structure
- #Cluster
- #Tree Diagram
- #Chain Diagram
- #16:9
- #cluster diagram PowerPoint
- #connected diagram slide
- #service architecture diagram
- #3-node diagram template
- #relationship diagram PPT
- #technical structure visualization
- #how to create cluster diagram in PowerPoint
About the Product
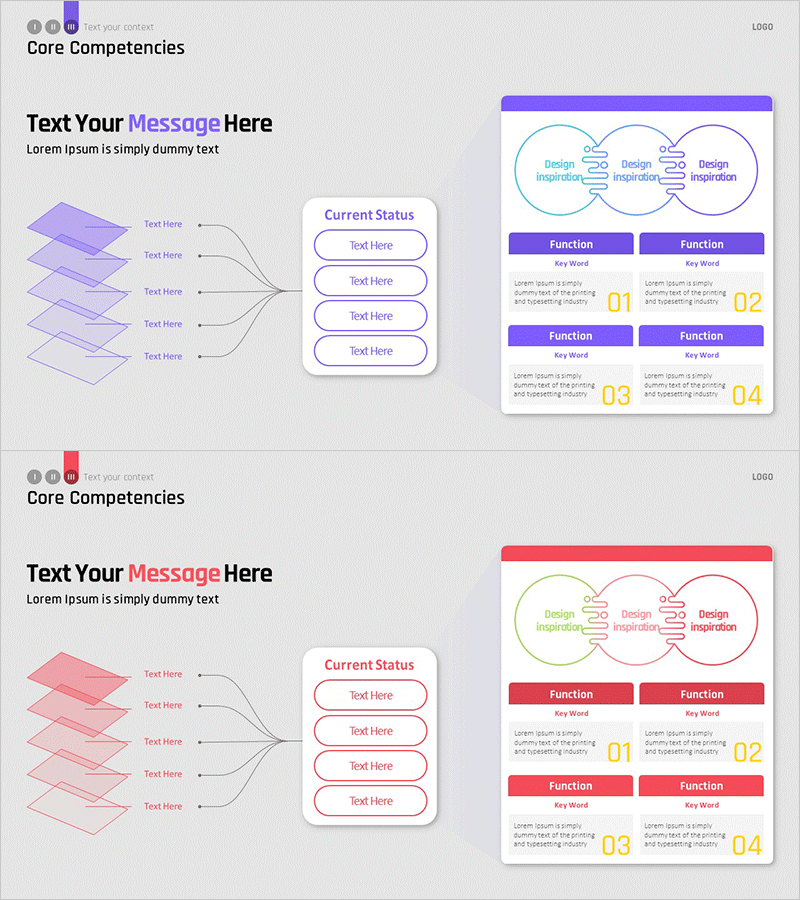
A cluster diagram PowerPoint slide featuring three circular nodes connected by central linking lines, ideal for visualizing service relationships and system interactions. Each node displays Design Inspiration text with directional arrow icons. The slide includes three color versions in purple, blue, and pink, with a structured layout below featuring two Function sections with Key Word labels and descriptive text areas for detailed explanations. This PowerPoint diagram slide is perfect for technology presentations, service architecture explanations, and system implementation case studies.
Usage Points
-
Main Usage
This cluster diagram is optimized for visualizing interconnected relationships between services, systems, and technical components. The central connecting lines clearly express the relationship structure of three elements, while the Function sections below each node allow for detailed explanations, making it highly effective for communicating complex architectural structures.
-
How to Use
Use this slide in technology department presentations, service architecture explanations, and system implementation case study reports to express relationships between core components. Simply modify the node text and Function items to match your project context, and select the color version that aligns with your presentation's overall tone and branding.
-
Recommended For
Recommended for IT and software engineering teams presenting system design, startups explaining service architecture, consulting firms proposing technical solutions, and manufacturing companies describing production system configurations. Best suited for professional presentations targeting audiences with technical expertise and understanding.
-
Slide Structure
Three circular nodes connected by central linking lines. Each node contains Design Inspiration text with directional arrow icons. Below are two Function sections with purple and pink headers, plus four input areas for Key Word and descriptive text. Three color theme options provided: purple, blue, and pink variants.
Related Products
-

Orbital Style Diagram – Connection and Innovation
#Technical Approach #Diagram #Service Architecture Diagram
-

Exercise Equipment and Infographic Elements – Innovative Business Strategy
#Business Vision and Strategy #Technical Approach #Diagram
-

Circular Organization Diagram – Intuitive Connection Structure
#Company Introduction #Technical Approach #Diagram
-

Tablet Shape Structure Diagram – Visualization of Technology and Service Composition
#Technical Approach #Diagram #Service Architecture Diagram
