Solution System Configuration Diagram – Multi-Dimensional Problem Solving
RM0800001_11
- Last Update 02/27/2025
- File Size 0.9MB
- # of Slides 2
- File Format PPTX
- Slide Ratio 16:9
- Color
Keywords
- #Content-Based Slides
- #Design-Based Slides
- #Operational Plan
- #Technical Approach
- #Diagram
- #Mitigation Measures
- #System Architecture Diagram
- #Flow
- #Multidirectional Flow
- #16:9
- #multi-directional diagram PowerPoint
- #problem-solving system flowchart
- #process flow diagram slide
- #decision tree PowerPoint template
- #convergence diagram PPT slide
About the Product
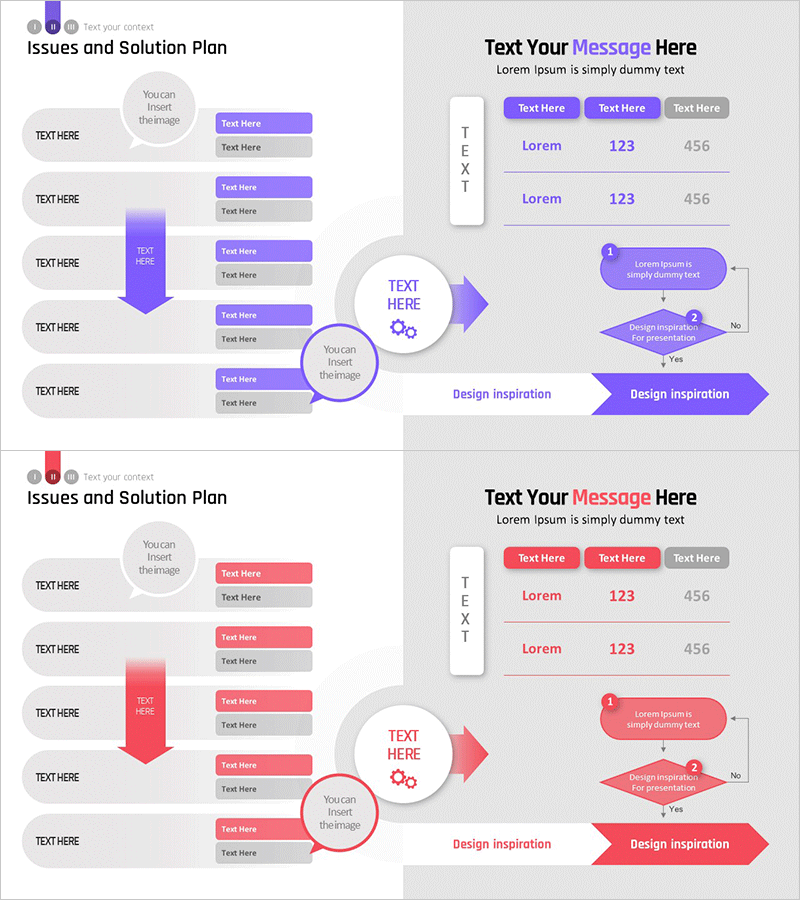
A multi-directional diagram PowerPoint slide that systematically connects issues to solutions through a convergence flow. Five text input nodes on the left channel into a central processing hub, then branch into a right-side flowchart with decision diamonds and outcome boxes. Purple and red gradient arrows, circular nodes, and hexagonal decision boxes create a cohesive visual hierarchy ideal for technical architecture, operational process, and strategic planning presentations. Two-slide set with color theme variations (purple and red), 16:9 widescreen PPTX format, fully editable.
Usage Points
-
Main Usage
Visualize complex problem-solving workflows where multiple inputs converge through a central processing stage and branch into decision logic leading to final outcomes. Clearly communicate technical system architecture, operational procedures, or strategic decision frameworks to stakeholders through intuitive visual flow.
-
How to Use
Enter specific issues or input values in the five left-side text boxes, define the processing method in the central node, and populate the right-side flowchart with decision criteria and results. All arrows, shapes, and text are fully editable; colors, sizes, and fonts can be customized. Additional nodes can be inserted to expand the diagram.
-
Recommended For
Technical system design presentations, operational process improvement proposals, executive strategy briefings, consulting project deliverables, quality assurance and risk management analyses. Particularly effective when presenting multi-layered problem analysis and step-by-step solution frameworks to technical and management audiences.
-
Slide Structure
Slide 1: Purple theme – five circular input nodes (left), central processing hub with gear icon, right-side arrow flowchart with two decision diamonds and outcome box. Slide 2: Red theme – identical structure with color variation. All shapes support text editing; 16:9 widescreen layout throughout.
Related Products
-

Multidirectional Flow Diagram for Business System Architecture
#Technical Approach #Diagram #Service Architecture Diagram
-

Square Frame Presentation Template – Risk Management Diagram
#Operational Plan #Technical Approach #Diagram
-

Multidirectional Flow Diagram – Product/Service Presentation and Solutions
#Product/Service Introduction #Operational Plan #Diagram
-

Learning Flow Across Five Key Areas - Multidirectional Tool
#Business Introduction #Technical Approach #Diagram
