Cooperative Systems Diagram – Visualizing Technical Integration
RM0800001_20
- Last Update 02/27/2025
- File Size 0.9MB
- # of Slides 2
- File Format PPTX
- Slide Ratio 16:9
- Color
Keywords
- #Content-Based Slides
- #Design-Based Slides
- #Product/Service Introduction
- #Technical Approach
- #Diagram
- #Composition
- #System Architecture Diagram
- #Cluster
- #Chain Diagram
- #16:9
- #central hub connection diagram PowerPoint
- #cooperative systems slide template
- #3-node structure diagram
- #system integration PowerPoint slide
- #technical architecture presentation template
About the Product
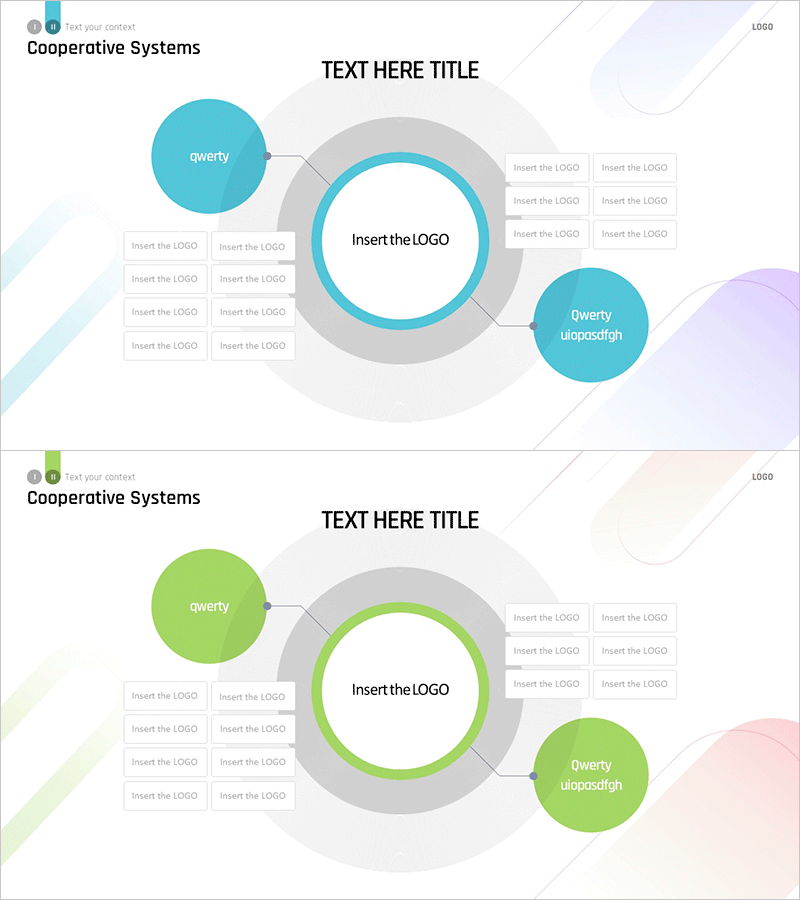
A cooperative systems diagram PowerPoint slide featuring a central hub node connected to two peripheral nodes on the left and right. Available in two color versions: turquoise and lime green, with the central circle emphasized by a gray border. The left side includes four logo insertion areas for representing technology partners, integration standards, or system components. Formatted in 16:9 widescreen with 2 slides, fully editable and ready for immediate use in technical presentations, system architecture explanations, and integration strategy documents.
Usage Points
-
Main Usage
Visualizes collaborative system structures, integrated architectures, and multi-element connection relationships. The symmetrical left-right node arrangement around a central hub effectively represents balanced system configurations, allowing insertion of logos, system names, or department labels to specify technical components and stakeholder relationships.
-
How to Use
Enter the core system name in the central circular node and add connected systems or partner organization names in the left and right nodes. Insert technology partner logos, integration technologies, or industry standards in the four left-side logo areas to reinforce technical credibility. Select either the turquoise or lime green version to match your corporate brand colors.
-
Recommended For
Ideal for IT and technology executive presentations, system integration (SI) proposals, technical architecture documentation, partner relationship diagrams, cloud and network infrastructure explanations, and digital transformation strategy presentations. Recommended for technology officers, systems engineers, and IT strategy planners who need to communicate complex system structures intuitively.
-
Slide Structure
Two-slide layout with each slide featuring a central circular node (gray border with turquoise or lime green accent) connected to two peripheral circular nodes via connector lines. Left side displays four logo insertion areas in a 2×2 grid arrangement, right side shows three logo areas, accommodating seven external elements total.
Related Products
-

IoT Service Configuration Diagram – Visual Explanation for Technology Sector
#Product/Service Introduction #Technical Approach #Diagram
-

Ship System Configuration Diagram – Technology Introduction
#Product/Service Introduction #Technical Approach #Diagram
-

Diagram Slide Visualizing Payment System Configuration Contents
#Product/Service Introduction #Technical Approach #Diagram
-

Experimental Setup Diagram – Technology and Innovation
#Product/Service Introduction #Technical Approach #Diagram
