Service Distribution Strategy – Operations and Marketing Plan
RM0800001_15
- Last Update 02/27/2025
- File Size 1MB
- # of Slides 2
- File Format PPTX
- Slide Ratio 16:9
- Color
Keywords
- #Content-Based Slides
- #Design-Based Slides
- #Operational Plan
- #Marketing Plan and Strategy
- #Diagram
- #Production and Technology Development Strategy
- #Marketing Strategy
- #Flow
- #Linear Flow
- #16:9
- #service deployment diagram PowerPoint
- #linear flow slide template
- #operations planning presentation
- #marketing strategy diagram
- #3-step process PowerPoint slide
About the Product
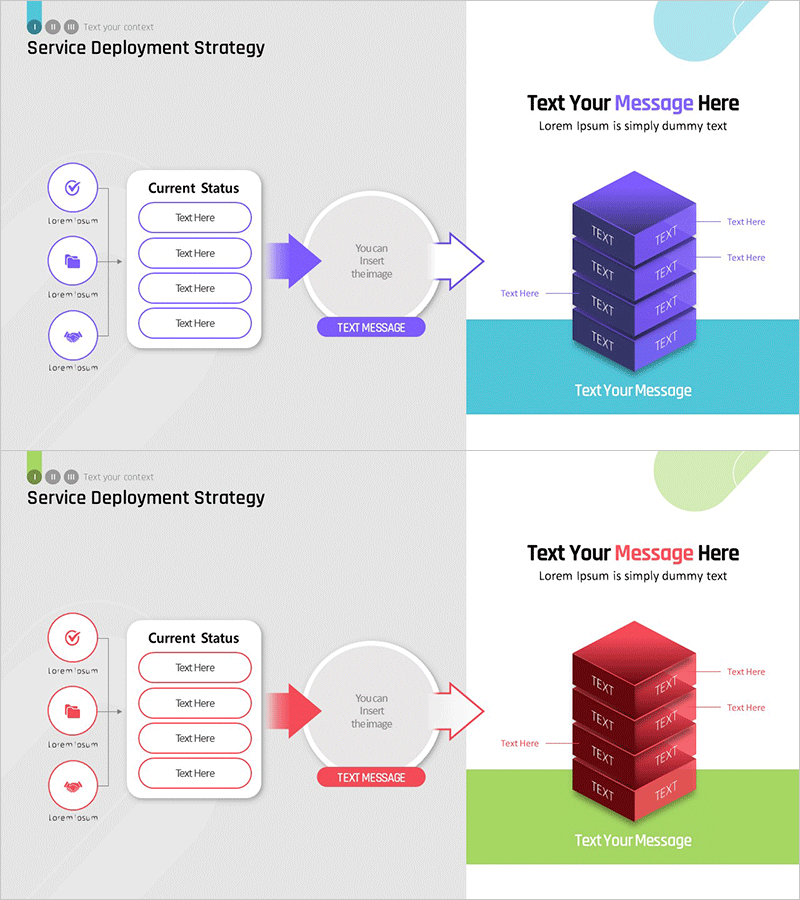
A PowerPoint slide that visualizes service deployment strategy through a 3-step linear diagram. The flow structure—Current Status Analysis → Central Decision-Making → Final Output—clearly represents operations planning and marketing strategy in sequential stages. The left-side icon list (checkmark, folder, collaboration icons) connects to a central arrow flow and a right-side 3D cube stack structure, with both blue and red color versions included. Each slide is in 16:9 ratio PPTX format, fully editable, and enables clear communication of service launch schedules, deployment phases, and marketing milestones to stakeholders.
Usage Points
-
Main Usage
Visualizes service deployment process in sequential stages to communicate deployment strategy and timeline clearly to operations, marketing, and executive teams. The linear flow from current analysis through decision-making to final output structures each phase's role and accountability.
-
How to Use
Insert into business plan or operations plan presentations in the service launch strategy section, or use in marketing proposal documents for deployment schedule and phase-by-phase strategy explanation. Edit left-side icons and text to reflect actual operational items, and input specific deliverables into the central arrow flow and right-side cube structure.
-
Recommended For
Operations leaders, marketing managers, product team heads, business development professionals, and executives preparing status reports. Suitable for any presentation requiring service deployment timeline explanation, particularly effective when emphasizing both multi-stage processes and final deliverables simultaneously.
-
Slide Structure
Slide 1 (blue version): Left-side 3-icon list + center circular decision node + bidirectional arrow connections + right-side 4-tier 3D cube stack. Slide 2 (red version): identical structure with color variation. Each element is independently editable with text boxes and shapes grouped for easy customization.
Related Products
-

Diagram Slide Representing Core Values and Vision
#Company Introduction #Marketing Plan and Strategy #Diagram
-

Business Strategy Structure Diagram – Strategic Visualization for Success
#Business Vision and Strategy #Marketing Plan and Strategy #Diagram
-

Maple Leaf Arrow Future Plans Slide
#Operational Plan #Technical Approach #Diagram
-

Corporate Strategy Diagram Leading the Future – Visualizing Business Flow
#Business Vision and Strategy #Marketing Plan and Strategy #Diagram
