Template Visualizing Mobile PC Service Operation Plan
RJ0300014_11
- Last Update 04/21/2025
- File Size 4.4MB
- # of Slides 2
- File Format PPTX
- Slide Ratio 16:9
- Color
Keywords
About the Product
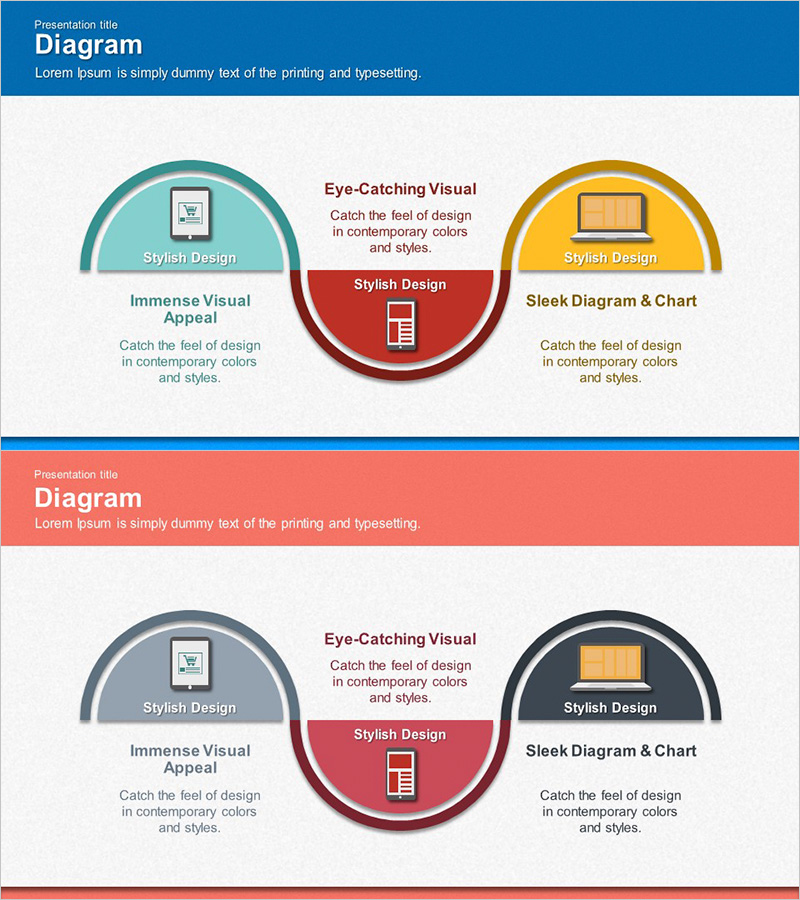
A three-node connected diagram PowerPoint slide visualizing mobile and PC service operation plans. The design features a central red circular node connected to a left teal semicircular node and a right golden semicircular node, each containing icon and text areas. Delivered as a 2-slide deck in 16:9 widescreen format, this presentation template is ready for immediate use in technology department briefings, service operation discussions, and system architecture presentations. All elements—text, colors, and icons—are fully editable using standard PowerPoint tools.
Usage Points
-
Main Usage
Visualizes service operation systems, technology architecture, and system connectivity by organizing three key elements. The hub-and-spoke structure radiates from a central node to left and right components, enabling hierarchical representation of core operation strategies and detailed execution items. Ideal for technology departments, IT teams, and development organizations presenting strategic plans.
-
How to Use
Enter operation items, technology components, and responsible departments in each node's text area. Typical layout: mobile service in the left teal node, integrated operation system in the central red node, and PC service in the right golden node. Colors, icons, and text sizes are fully customizable using PowerPoint's native editing tools.
-
Recommended For
Technology managers, IT directors, system architects, development team leads, and service operation managers explaining technology strategies, system structures, and operation plans. Effective for internal meetings, executive briefings, client presentations, and technical seminars where complex operation systems require intuitive visual communication.
-
Slide Structure
Two-slide presentation with each slide featuring a central red circular node (approximately 40% height) and left teal and right golden semicircular nodes (each approximately 35% height). Each node contains a separated icon area (top) and text input area (bottom), with connecting lines representing relationships between nodes. Provided in 16:9 widescreen PPTX format.
Related Products
-

How to Measure Smart Health – Visualizing Effective Data Flow
#Operational Plan #Technical Approach #Diagram
-

Automobile Management Service System – Efficient Operation Strategy
#Technical Approach #Diagram #Service Operation Plan
-

Keywords for Exercise Programs Slide – Beautiful Design and Innovative Flow
#Technical Approach #Diagram #Service Operation Plan
-

Diagram Slide Visualizing Propulsion Systems and Plans – Clear Strategies and Implementation Guidance
#Business Strategy #Technical Approach #Diagram
