Future Outlook Analysis Diagram – Business Strategy Development
RJ0300011_11
- Last Update 04/21/2025
- File Size 0.8MB
- # of Slides 2
- File Format PPTX
- Slide Ratio 16:9
- Color
Keywords
- #Content-Based Slides
- #Design-Based Slides
- #Business Strategy
- #Market and Competitor Analysis
- #Diagram
- #Achievements
- #Future Outlook
- #Flow
- #Linear Flow
- #16:9
- #future outlook analysis diagram PowerPoint
- #3-stage arrow diagram slide template
- #business analysis presentation
- #market forecast PPT slide
- #growth trend visualization
- #executive report PowerPoint template
About the Product
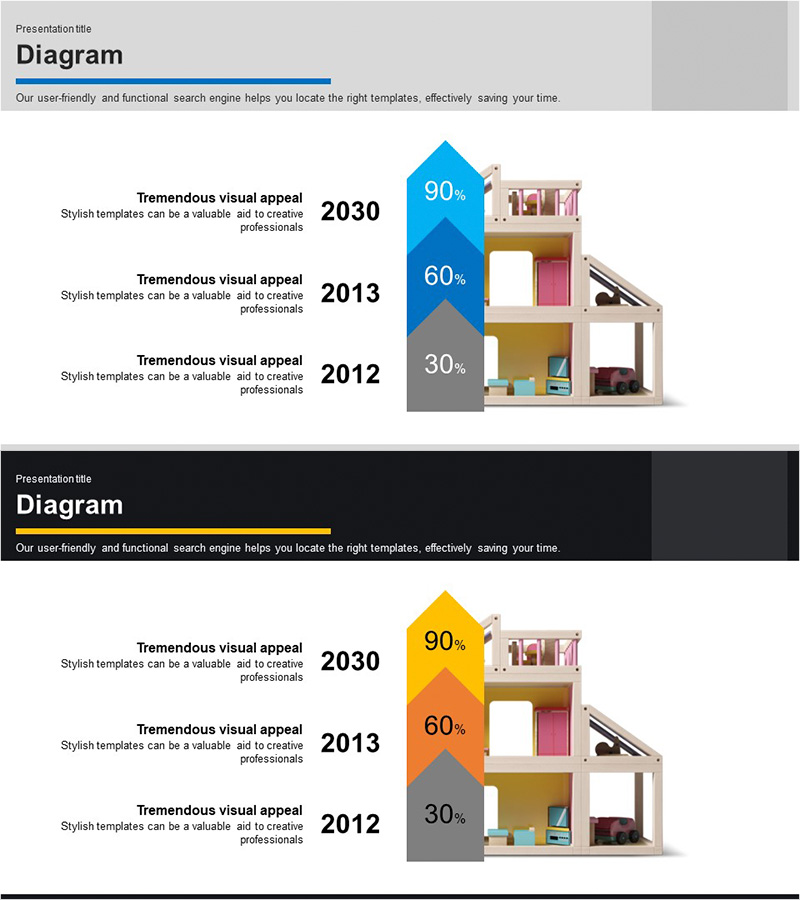
A professional future outlook analysis diagram PowerPoint slide essential for business strategy development and market analysis presentations. This 2-slide deck features an arrow-shaped diagram with blue and orange gradient color scheme, visualizing year-over-year growth trends and percentage data. Provided in 16:9 widescreen PPTX format with dedicated text input areas and percentage display spaces for each stage. The building mockup imagery makes it ideal for real estate, construction, and development project forecasts. Perfect for executive reports, investor pitch decks, business plan presentations, competitive analysis, and market growth projections. Each slide combines structured data visualization with visual context to enhance audience comprehension of future business outlook.
Usage Points
-
Main Usage
Visualize future business outlook and growth trends in stages to support clear data communication in executive reports, investor pitch decks, and business plan presentations. The arrow-shaped diagram enables year-over-year growth rate comparison and future forecasting, enhancing audience understanding of strategic direction.
-
How to Use
Enter year and business content in each stage's text input area, and input growth rate percentages in the designated boxes. Use blue tone for past/present and orange tone for future outlook. The building mockup can be retained for real estate and construction projects or replaced to match your industry context.
-
Recommended For
Ideal for executive and C-level quarterly and annual business reports, investor relations materials, new business initiative presentations, real estate and construction company project forecasts, marketing team market growth projections, and consulting firm strategic proposals.
-
Slide Structure
2-slide deck with 3-stage arrow-shaped diagram on each slide. Left side features year-by-year text description areas (3 sections), center displays blue, orange, and gray gradient arrow nodes (3 nodes each), right side includes building mockup imagery, and each node contains dedicated percentage input space.
Related Products
-

Year-by-Year Growth Timeline Slide
#Business Strategy #Market and Competitor Analysis #Diagram
-

War and Broken Line Graph – Market and Competitor Analysis Strategy
#Business Strategy #Market and Competitor Analysis #Graph
-

Graph Analyzing Lung Cancer Treatment Trends – Market Potential and Future Outlook
#Business Strategy #Market and Competitor Analysis #Graph
-

Slide Template for Effectively Delivering Performance Details
#Business Strategy #Business Management #Diagram
