Year-by-Year Growth Timeline Slide
RB0100008_6
- Last Update 03/01/2025
- File Size 0.4MB
- # of Slides 2
- File Format PPTX
- Slide Ratio 4:3
- Color
Keywords
- #Content-Based Slides
- #Design-Based Slides
- #Business Strategy
- #Market and Competitor Analysis
- #Diagram
- #Financial Outlook & Expected Impact
- #Future Outlook
- #Flow
- #Linear Flow
- #4:3
- #timeline diagram PowerPoint
- #business milestone slide
- #linear flow diagram
- #growth visualization
- #year-by-year progress PowerPoint slide
About the Product
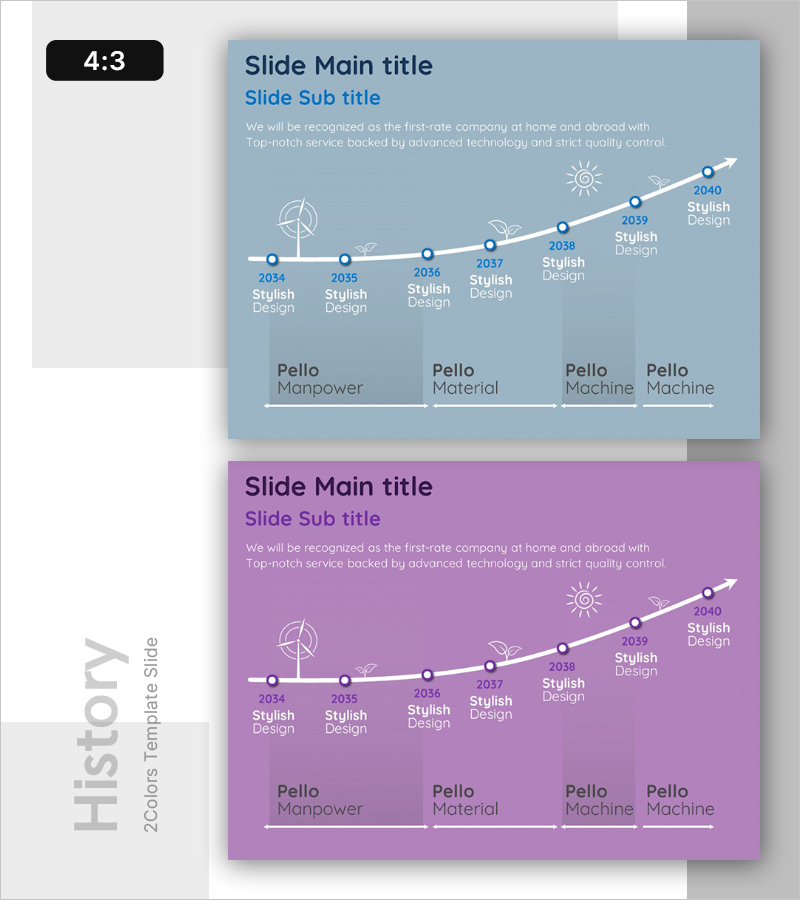
A linear timeline diagram PowerPoint slide that visualizes year-by-year business growth and milestones from 2034 to 2040. The slide features a curved progression with 7 circular nodes, each ready for year labels, project names, and department assignments. The design combines a light blue background with white curved lines, circular markers, and an upward arrow icon to emphasize growth trajectory. Includes two color variations—blue and purple—in 4:3 aspect ratio, making it immediately applicable to business presentations, annual reports, and strategic roadmaps.
Usage Points
-
Main Usage
Designed to present corporate history, business development phases, and growth milestones in chronological order. Each node accommodates year labels and project descriptions, enabling clear communication of organizational evolution and strategic achievements.
-
How to Use
Enter years and milestone titles into the 7 circular nodes along the timeline curve. Add department names or project details in the bottom section boxes. All colors, node sizes, and text are fully editable to match your brand guidelines.
-
Recommended For
Ideal for company history presentations, business plans, executive reports, investor pitches, and organizational development timelines. Particularly effective for startups showcasing growth stages, enterprises illustrating business expansion, and project roadmap presentations.
-
Slide Structure
7-node curved timeline diagram with linear progression + 4-section text boxes at bottom. Includes blue background version and purple background version. 4:3 aspect ratio PPTX format with grouped elements for easy resizing and color customization.
Related Products
-

Stereographic Area Graph for Data Analysis and Market Outlook
#Business Strategy #Market and Competitor Analysis #Graph
-

Growth Curve Area Graph - Market and Competitive Analysis
#Business Strategy #Market and Competitor Analysis #Graph
-

Denim PPT Vertical Bar Graph Analysis – Market and Competitor Analysis
#Business Strategy #Market and Competitor Analysis #Graph
-

Business Cartoon Theme Future Prospects – Visualizing Market Trends
#Market and Competitor Analysis #Diagram #Graph
