Comparative Graph of Economic Growth – Performance Analysis and Future Prospects
RJ0800037_14
- Last Update 08/10/2025
- File Size 0.2MB
- # of Slides 2
- File Format PPTX
- Slide Ratio 16:9
- Color
Keywords
- #Content-Based Slides
- #Design-Based Slides
- #Business Strategy
- #Market and Competitor Analysis
- #Graph
- #Achievements
- #Future Outlook
- #Column
- #Grouped Column
- #16:9
- #grouped bar chart PowerPoint
- #economic growth comparison slide
- #performance analysis template
- #data comparison presentation
- #how to create bar chart in PowerPoint
About the Product
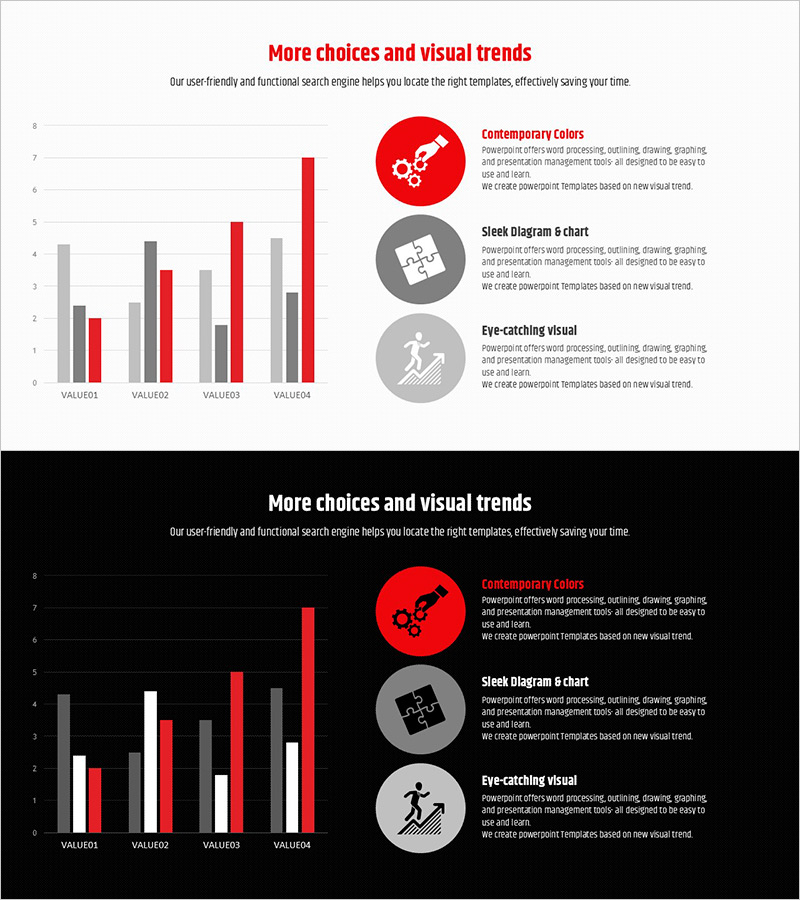
A grouped bar chart PowerPoint slide designed to visually compare and analyze economic growth trends and performance metrics. Two layout versions are provided with light and dark backgrounds, using contrasting red, gray, and white color schemes to clearly distinguish data series. The slide displays 2 data series across 4 items (VALUE01 to VALUE04) in side-by-side columns, enabling simultaneous representation of performance comparison and future outlook. This presentation template is ready to use in business reports, performance analysis documents, and market research presentations.
Usage Points
-
Main Usage
Ideal for comparing two data series—such as economic growth rates, sales performance, or market share—across four categories. Supports quantitative analysis in performance reviews, future outlook presentations, and competitive benchmarking.
-
How to Use
Replace VALUE01 through VALUE04 item names and numerical values with your own data. Use the light background version for projector presentations and the dark background version for online sharing or printing.
-
Recommended For
Suited for executives, finance teams, marketing departments, and strategic planning teams presenting quarterly or annual performance reports, business plans, and investor presentations. Commonly used in consulting, finance, manufacturing, and retail industries where data-driven decision-making is critical.
-
Slide Structure
2-slide set. Each slide features a grouped bar chart (2 data series) with 4 items centered on the slide, title and description area at the top, and 3 icon-text elements (Contemporary Colors, Sleek Diagram & chart, Eye-catching visual) positioned on the right.
Related Products
-

Food Ingredient Graph – Family Recipe Data Visualization
#Business Strategy #Financial Plans and Performance #Graph
-

Cash Flow and Earnings Outlook Chart
#Business Introduction #Market and Competitor Analysis #Graph
-

Flowering Period Graph – Future Outlook Analysis
#Market and Competitor Analysis #Graph #Future Outlook
-

War and Broken Line Graph – Market and Competitor Analysis Strategy
#Business Strategy #Market and Competitor Analysis #Graph
