Segmented Vertical Bar Graph Identity Wide Template – Analysis and Vision Presentation
RJ0200003_16
- Last Update 03/29/2025
- File Size 0.8MB
- # of Slides 2
- File Format PPTX
- Slide Ratio 16:9
- Color
Keywords
- #Content-Based Slides
- #Design-Based Slides
- #Business Strategy
- #Market and Competitor Analysis
- #Graph
- #Achievements
- #Future Outlook
- #Column
- #Segmented Column
- #16:9
- #segmented vertical bar chart PowerPoint
- #bar graph slide template
- #data comparison chart
- #market analysis PowerPoint
- #business analysis slide
About the Product
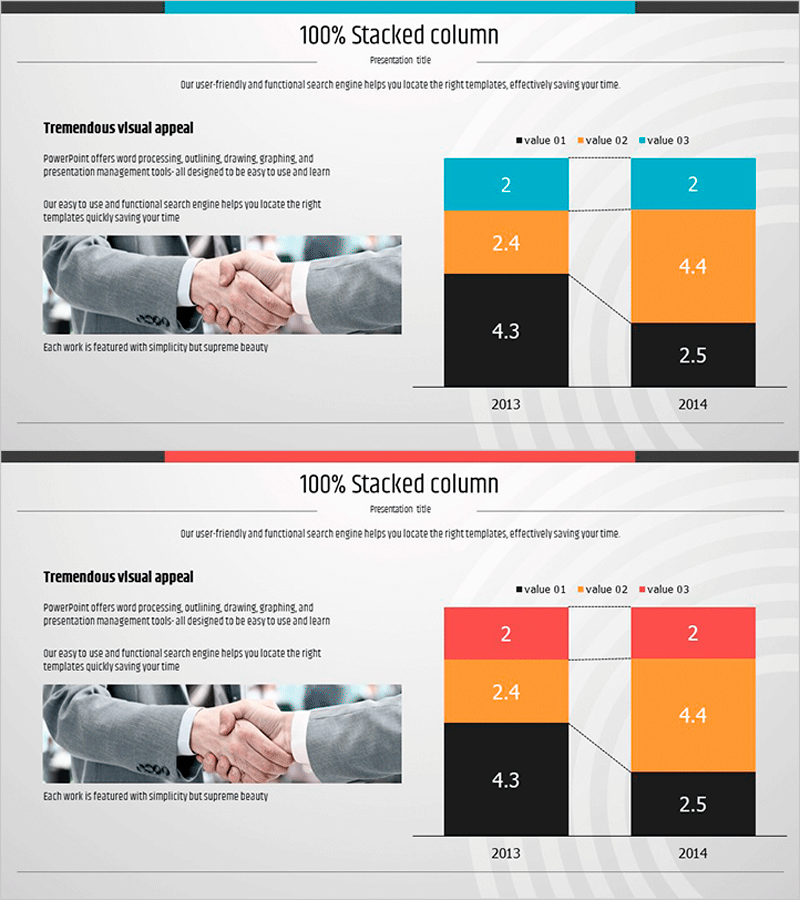
A vertical bar chart PowerPoint slide that segments 2013 and 2014 data into three distinct values for comparative analysis. The slide uses a three-color scheme—cyan, orange, and black—to represent each data series, enabling clear visualization of year-over-year changes across multiple metrics. Ideal for business strategy presentations, market analysis reports, and competitive benchmarking. The 16:9 widescreen format with 2-slide layout allows you to input your data and present immediately without additional design work.
Usage Points
-
Main Usage
Compares quantitative data across two time periods (2013 and 2014) with three segmented values per period. Designed to present business performance metrics, market size comparisons, and competitive benchmarking in a single, easy-to-understand visual format.
-
How to Use
Replace the sample values with your own data and update the legend labels as needed. The dual-year structure emphasizes trend changes, making it suitable for business strategy sections, quarterly reports, and market overview presentations.
-
Recommended For
Executives, marketing teams, strategic planners, and sales professionals presenting quarterly reports, business plans, proposals, and investor pitches. Particularly effective when demonstrating year-over-year performance or competitive landscape analysis.
-
Slide Structure
2-slide deck. Each slide displays two year groups (2013 and 2014) with three segmented vertical bars per group. Color-coded series (cyan, orange, black) with value labels and legend for easy data interpretation.
Related Products
-

Subdivision Vertical Graph Comparison Type – Optimal for Business Strategy Analysis
#Business Strategy #Market and Competitor Analysis #Graph
-

Year-by-Year Breakdown Comparison Analysis Graph
#Market and Competitor Analysis #Graph #Future Outlook
-

Arctic Business Market Analysis Chart by Year – Visualizing Business Goals
#Business Vision and Strategy #Market and Competitor Analysis #Diagram
-

War and Broken Line Graph – Market and Competitor Analysis Strategy
#Business Strategy #Market and Competitor Analysis #Graph
