Eco-friendly Business Project Line Graph – Embracing Sustainability
RJ0600070_9
- Last Update 07/08/2025
- File Size 5.1MB
- # of Slides 2
- File Format PPTX
- Slide Ratio 16:9
- Color
Keywords
- #Content-Based Slides
- #Design-Based Slides
- #Business Strategy
- #Market and Competitor Analysis
- #Graph
- #Achievements
- #Future Outlook
- #Line
- #Line Chart
- #16:9
- #line chart PowerPoint
- #dual-series line graph
- #trend analysis slide
- #data visualization PPT
- #10-year comparison chart
- #PowerPoint slide template download
About the Product
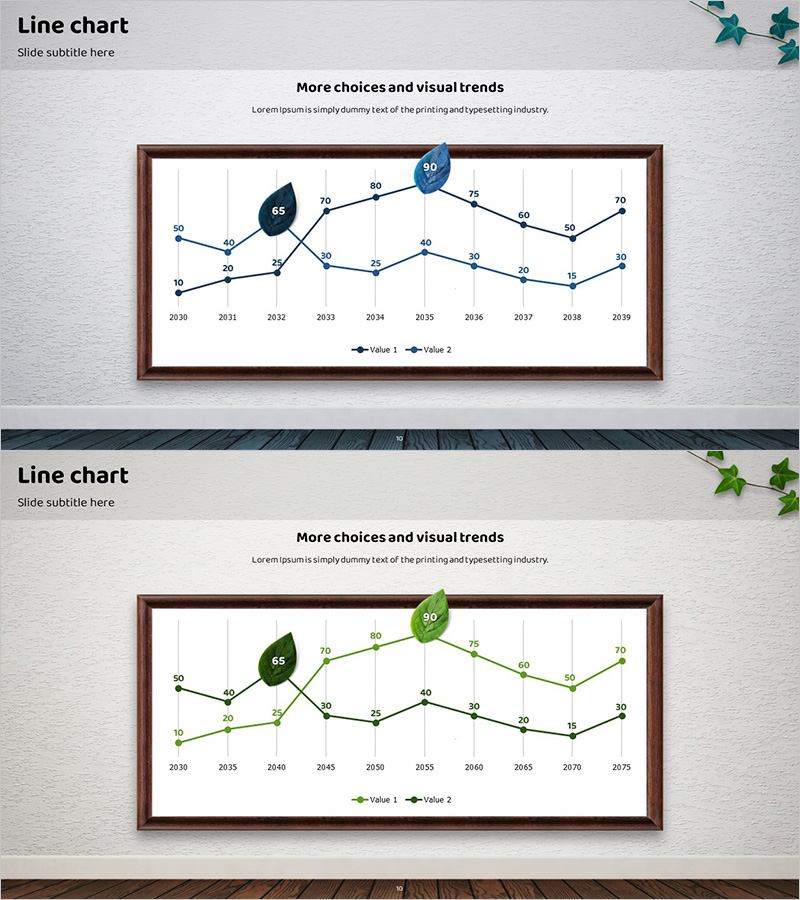
A PowerPoint line chart slide comparing two data series across a 10-year period from 2030 to 2039, visualizing change trends with dual blue-toned lines. Each data point displays numerical labels for precise value identification, while the wooden frame background adds warmth and professionalism to presentations. This slide template is ready for immediate use in business reports, market analysis presentations, and strategic planning decks. The dual-line design effectively highlights comparative trends and performance metrics across extended time periods.
Usage Points
-
Main Usage
Compares two data series over time to reveal trend patterns and performance changes. Ideal for presenting annual revenue trends, market share evolution, customer satisfaction metrics, or any time-series data requiring dual-line comparison for strategic insights.
-
How to Use
Insert into business reports, market analysis presentations, investor pitch decks, or quarterly performance reviews. Replace sample data with your own figures and adjust colors as needed. The wooden frame design maintains professional appearance while the grid structure ensures data clarity and readability.
-
Recommended For
Executive presentations, quarterly business reviews, market research reports, financial analysis documents, and strategic planning sessions. Suitable for marketing teams, sales departments, finance teams, and business analysts who need to communicate performance trends and comparative metrics.
-
Slide Structure
Two intersecting line series spanning 10 time intervals with numerical labels at each data point. Legend distinguishes Value 1 and Value 2. Wooden frame border and grid lines enhance data readability and visual hierarchy.
Related Products
-

Trends in Flower Market Size – Data-Driven Insights
#Business Strategy #Market and Competitor Analysis #Graph
-

Blue Green Break Line Chart Analysis – Business Strategy and Market Analysis
#Business Strategy #Market and Competitor Analysis #Graph
-

War and Broken Line Graph – Market and Competitor Analysis Strategy
#Business Strategy #Market and Competitor Analysis #Graph
-

Graph Analyzing Lung Cancer Treatment Trends – Market Potential and Future Outlook
#Business Strategy #Market and Competitor Analysis #Graph
