Flow Diagram for Business Strategy – Business Plan Presentation Template
RJ0200027_15
- Last Update 04/05/2025
- File Size 1.5MB
- # of Slides 2
- File Format PPTX
- Slide Ratio 16:9
- Color
Keywords
- #Content-Based Slides
- #Design-Based Slides
- #Business Strategy
- #Financial Plans and Performance
- #Diagram
- #Implementation Framework
- #Flow
- #Table
- #Circular Flow
- #Standard Table
- #16:9
- #arrow flow diagram PowerPoint
- #process flow chart slide template
- #4-step business diagram
- #business strategy visualization PPT
- #circular flow diagram PowerPoint
About the Product
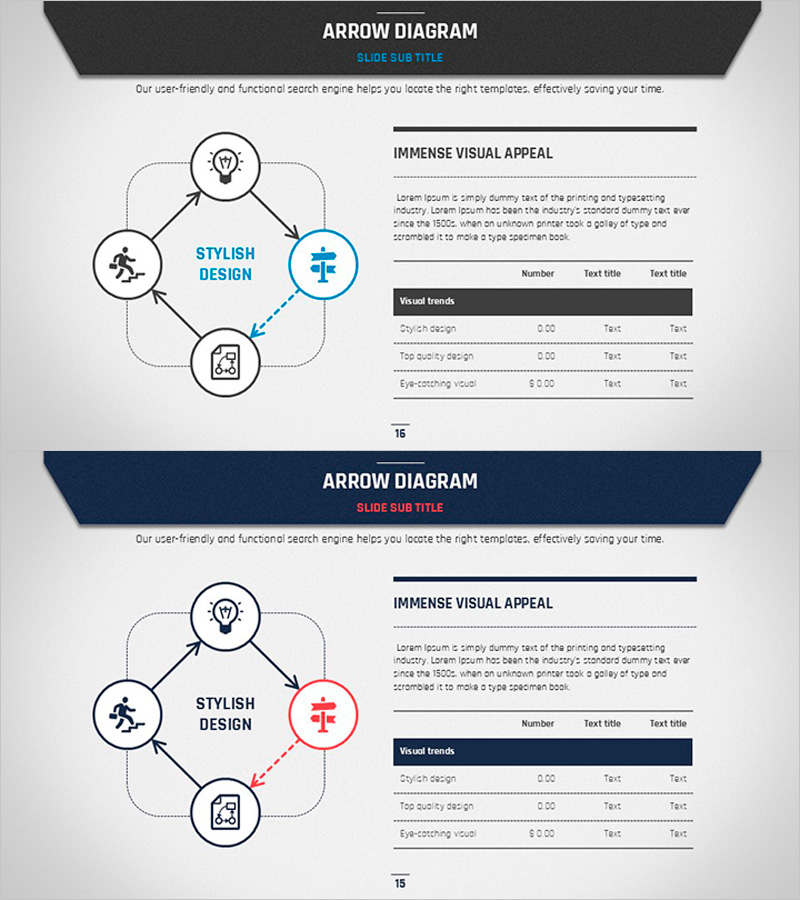
A 4-node arrow flow diagram PowerPoint slide that clearly visualizes business strategy execution and process progression. The design features circular nodes connected by directional arrows, with a central concept area for emphasis. Built on a dark gray background with blue accent color, this slide deck includes two color variations (blue and red) to suit different presentation contexts. Each node accommodates icons and text labels, making it ideal for business plans, financial strategies, project roadmaps, and strategic initiatives. The 16:9 widescreen format spans 2 slides, allowing flexible integration into presentation flows.
Usage Points
-
Main Usage
Visualizes business execution strategies, project phases, process workflows, and decision pathways using a 4-node arrow diagram structure. Each circular node accepts icons and text, emphasizing key concepts while arrows indicate causality and progression sequence, enabling intuitive communication of complex processes.
-
How to Use
Enter titles, descriptions, and icons into each circular node, then adjust colors to control emphasis levels. Select either the blue or red color variation based on presentation theme, then customize slide backgrounds and fonts to match corporate branding. The 16:9 format optimizes display on widescreen monitors.
-
Recommended For
Ideal for executive business plan presentations, project manager roadmap explanations, marketing team campaign phase visualization, finance team investment process descriptions, and consultant strategy proposals. The 4-step structure effectively communicates mid-scale projects and strategic planning processes.
-
Slide Structure
2-slide set. Each slide features 4 circular nodes arranged around a central concept area, connected by bidirectional arrows. Slide 1 uses blue accent color; Slide 2 uses red accent color for visual distinction. All elements are fully editable and customizable.
Related Products
-

Diet Table for Healthy Management – Your Path to Weight Loss
#Product/Service Introduction #Financial Plans and Performance #Diagram
-

Blue Line Wide Template Table1
#Financial Plans and Performance #Diagram #Sales and Revenue
-

Simple & Modern Wide PPT Mockup for Business Insights
#Market and Competitor Analysis #Financial Plans and Performance #Diagram
-

Changes in Sales and Future Outlook – Supporting Business Strategy
#Business Strategy #Financial Plans and Performance #Diagram
