Table Slide for Garden Industry Status Analysis
RJ0600103_11
- Last Update 08/28/2025
- File Size 1.2MB
- # of Slides 2
- File Format PPTX
- Slide Ratio 16:9
- Color
Keywords
- #Content-Based Slides
- #Design-Based Slides
- #Market and Competitor Analysis
- #Financial Plans and Performance
- #Diagram
- #Market Analysis
- #Sales and Revenue
- #Table
- #Standard Table
- #16:9
- #garden industry table slide
- #market analysis PowerPoint template
- #data comparison PPT
- #industry status analysis table
- #table diagram PowerPoint
- #6-column data presentation slide
About the Product
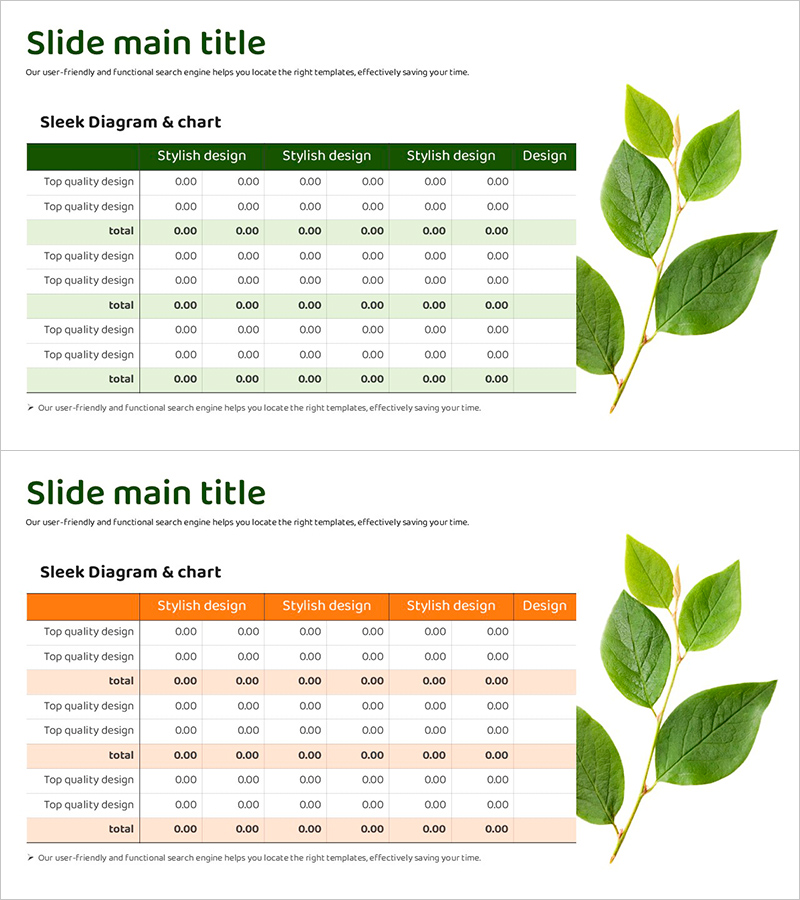
A professional table-format PowerPoint slide designed to present garden industry market data and status analysis with clarity and impact. Offered in two color variations—forest green and vibrant orange—this slide features a 6-column structure with multi-row organization to effectively display complex industry statistics. Each section is divided into 'Top Quality Design' categories and 'Total' rows, creating a hierarchical data presentation that guides viewers through the information logically. The green version suits environmental and sustainability themes, while the orange version emphasizes growth and activity. A fresh green plant illustration on the right reinforces the garden industry context. Delivered as 2 slides in 16:9 widescreen format, fully editable and ready to use immediately.
Usage Points
-
Main Usage
Visualize multi-layered garden industry data—market size, sales performance, growth rates—in a structured table format to communicate industry insights credibly to investors, stakeholders, and customers. Applicable to any business report, investment pitch, or marketing plan requiring comparative data analysis.
-
How to Use
Insert into the market analysis section of business plans, industry status slides in investor presentations, or data organization pages in quarterly performance reports. Select header color (green or orange) to match your document's visual identity, then replace placeholder values with actual data for immediate deployment.
-
Recommended For
Garden and landscaping industry professionals, horticulture startup founders, agricultural product manufacturers and distributors, marketing and planning teams, industry analysts, investment reviewers, government policy makers, and anyone requiring data-driven decision-making in the agricultural sector.
-
Slide Structure
Both slides follow identical structure: title area + 6-column table (4 'Stylish Design' columns + 1 'Design' column) × 9 rows (2 'Top Quality Design' rows + 1 'Total' row, repeated 3 times). Green version features dark green header with light green row backgrounds; orange version uses orange header with light peach row backgrounds. Green plant illustration positioned on the right side of each slide.
Related Products
-

Business Forest Wide Template Europe Map – A New Horizon for Market Analysis
#Market and Competitor Analysis #Financial Plans and Performance #Diagram
-

Sales and Profit Chart by Year – Effective Financial Analysis
#Market and Competitor Analysis #Financial Plans and Performance #Diagram
-

Liquor Sales Chart – Market Analysis and Performance Management
#Market and Competitor Analysis #Financial Plans and Performance #Diagram
-

Sales and Profit Table – Visualizing Financial Performance
#Market and Competitor Analysis #Financial Plans and Performance #Diagram
