Rainbow Presentation Template Arrow Diagram 2 – Clearly Portraying Business Strategy
RJ0200022_17
- Last Update 04/03/2025
- File Size 3.8MB
- # of Slides 2
- File Format PPTX
- Slide Ratio 16:9
- Color
Keywords
- #Content-Based Slides
- #Design-Based Slides
- #Business Strategy
- #Financial Plans and Performance
- #Diagram
- #Step-by-Step Schedule Plan
- #Flow
- #Table
- #Linear Flow
- #Standard Table
- #16:9
- #arrow diagram PowerPoint
- #4-step process flow slide
- #sequential diagram template
- #business strategy flowchart
- #how to create process flow in PowerPoint
About the Product
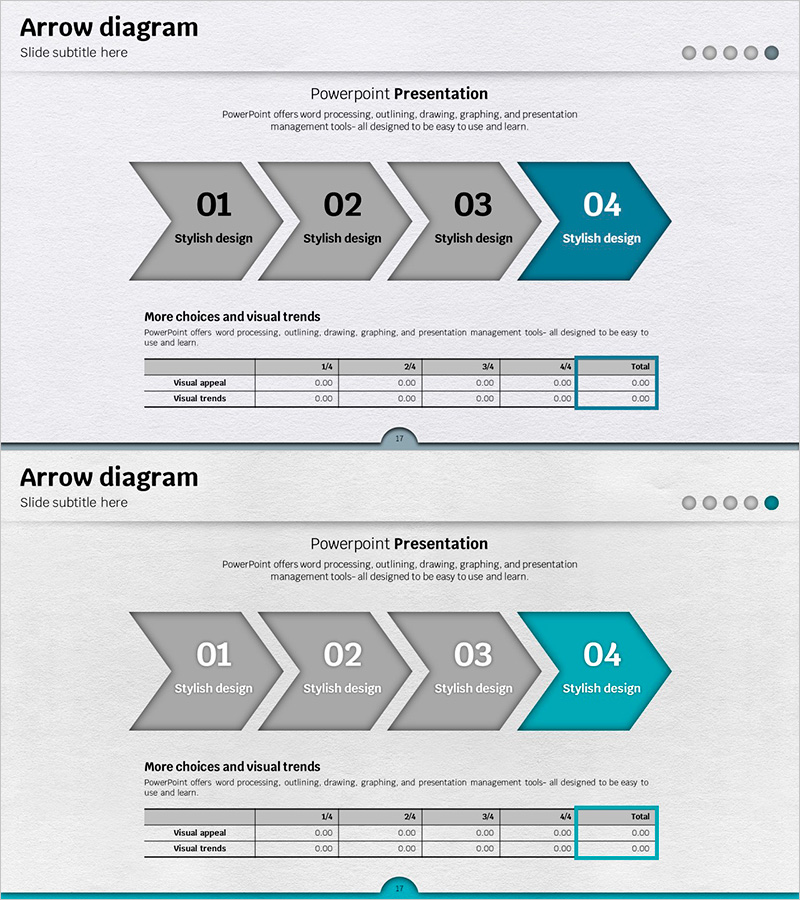
A left-pointing 4-step arrow flow diagram PowerPoint slide featuring gray tones for the first three stages and a teal accent color for the final stage to highlight progression. Each node accommodates numbered labels and custom text, making it ideal for visualizing sequential information in business presentations. The 2-slide set includes a primary diagram and a comparison table below, allowing you to present both qualitative process flows and quantitative data simultaneously. Perfect for business strategy rollouts, project phases, process workflows, and strategic initiatives.
Usage Points
-
Main Usage
Visualize sequential stages or processes using connected arrows to create a clear flow narrative. Ideal for business strategy rollouts, project roadmaps, marketing campaign phases, product development processes, and any 4+ stage linear progression requiring visual clarity.
-
How to Use
Replace the numbered labels and text in each arrow node with your own content. Use the teal-colored final stage to emphasize the end goal or completion milestone. Add quantitative metrics to the comparison table below to present both process flow and supporting data in a single view.
-
Recommended For
Strategy and planning departments presenting business initiatives, project managers explaining timelines and milestones, marketing teams showcasing campaign roadmaps, operations teams detailing process improvements, and executive presentations requiring clear phase visualization.
-
Slide Structure
Slide 1: 4-node left-pointing arrow diagram (3 gray nodes + 1 teal accent node) with title and descriptive text areas. Slide 2: Identical diagram with 4-column comparison table below (Visual appeal / Visual trends rows, 1/4 through 4/4 columns, Total summary column).
Related Products
-

Table of Required Funds Plan – Effective Fund Management
#Business Strategy #Financial Plans and Performance #Diagram
-

Smoking Cessation Progress Analysis Table Diagram – Example of Business Strategy Execution
#Business Strategy #Diagram #Step-by-Step Schedule Plan
-

Infographic Design Wide Template Step Diagram
#Business Strategy #Financial Plans and Performance #Diagram
-

Step by Step Diagram of Playing a Musical Instrument - Fundamentals of Music
#Business Strategy #Business Management #Diagram
