Table of Required Funds Plan – Effective Fund Management
RJ0300031_19
- Last Update 04/26/2025
- File Size 0.7MB
- # of Slides 2
- File Format PPTX
- Slide Ratio 16:9
- Color
Keywords
- #Content-Based Slides
- #Design-Based Slides
- #Business Strategy
- #Financial Plans and Performance
- #Diagram
- #Step-by-Step Schedule Plan
- #Capital Requirements
- #Flow
- #Table
- #Linear Flow
- #Standard Table
- #16:9
- #circular diagram PowerPoint
- #4-step process slide
- #data table template
- #fund allocation diagram
- #business phase funding management
About the Product
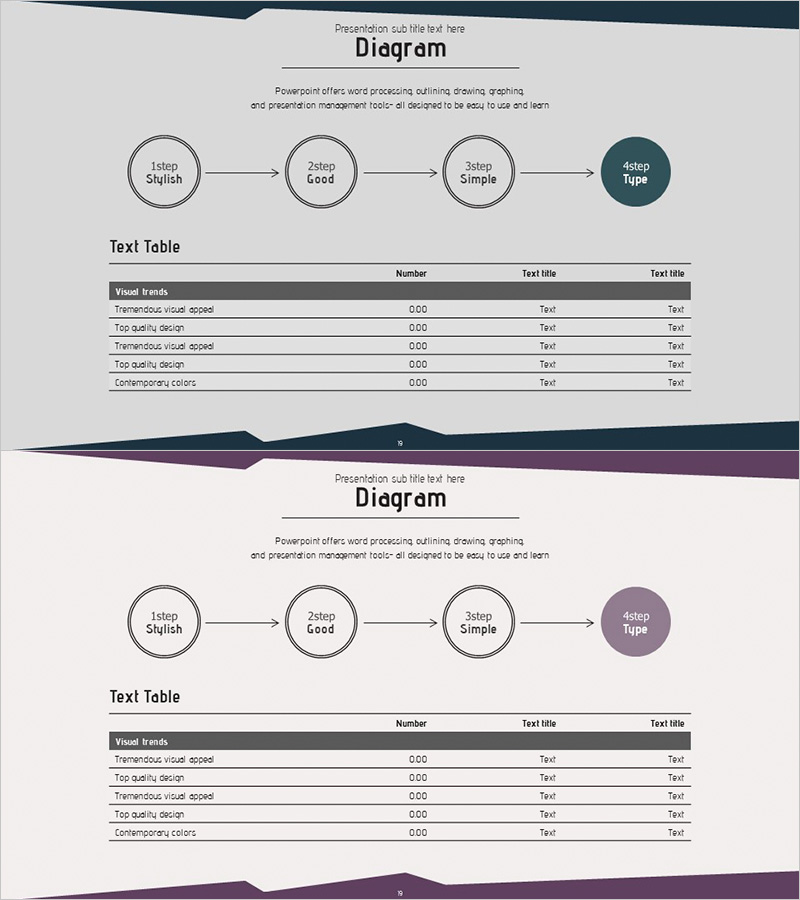
A 2-slide PowerPoint set that visualizes phased fund allocation for business execution. The first slide features a 4-node circular diagram showing progression from Step 1 (Stylish) → Step 2 (Good) → Step 3 (Simple) → Step 4 (Type), with the final node highlighted in dark gray to indicate completion status. The second slide presents a horizontal data table with 5 rows and 3 columns—Visual Trends, Number, and Text Title—enabling side-by-side comparison of fund amounts, deployment timing, and responsible departments. Optimized for 16:9 widescreen format in PPTX, fully editable and ready to integrate into company profiles, business plans, and investment proposals. Ideal for finance sections requiring both process visualization and numerical clarity.
Usage Points
-
Main Usage
Visualize phased fund allocation through a circular diagram while simultaneously organizing fund amounts, deployment schedules, and responsible departments in a structured table, ensuring both transparency and credibility in financial planning.
-
How to Use
Insert into the fund planning section of business plans, investment proposals, or financial reports to communicate fund allocation timelines and amounts clearly to executives, investors, and stakeholders. Align diagram nodes with table rows to create a cohesive narrative linking process stages to specific financial details.
-
Recommended For
CFOs, finance managers, business planning teams, and investment relations professionals presenting fund strategies. Particularly valuable for startup pitch decks, corporate new venture proposals, and government grant applications where clear fund flow visualization is essential.
-
Slide Structure
Slide 1: 4-node circular diagram (left-to-right progression with final node in emphasis color); Slide 2: 5-row × 3-column table (dark gray header row, white data rows, columns for Visual Trends, Number, and Text Title). Both slides include title area and decorative footer line.
Related Products
-

Rainbow Presentation Template Arrow Diagram 2 – Clearly Portraying Business Strategy
#Business Strategy #Financial Plans and Performance #Diagram
-

Step-by-Step Pricing Strategy Presentation Slide
#Business Strategy #Marketing Plan and Strategy #Diagram
-

Smoking Cessation Progress Analysis Table Diagram – Example of Business Strategy Execution
#Business Strategy #Diagram #Step-by-Step Schedule Plan
-

Renewable Energy Project Step-by-Step Schedule – Diagram for Strategic Progress
#Business Strategy #Diagram #Step-by-Step Schedule Plan
