Smoking Cessation Progress Analysis Table Diagram – Example of Business Strategy Execution
RJ0400037_9
- Last Update 05/27/2025
- File Size 5.4MB
- # of Slides 2
- File Format PPTX
- Slide Ratio 16:9
- Color
Keywords
- #Content-Based Slides
- #Design-Based Slides
- #Business Strategy
- #Diagram
- #Step-by-Step Schedule Plan
- #Flow
- #Table
- #Linear Flow
- #Standard Table
- #16:9
- #circular process diagram PowerPoint
- #4-step cycle slide template
- #table diagram presentation
- #business strategy execution slide
- #project phase PowerPoint template
About the Product
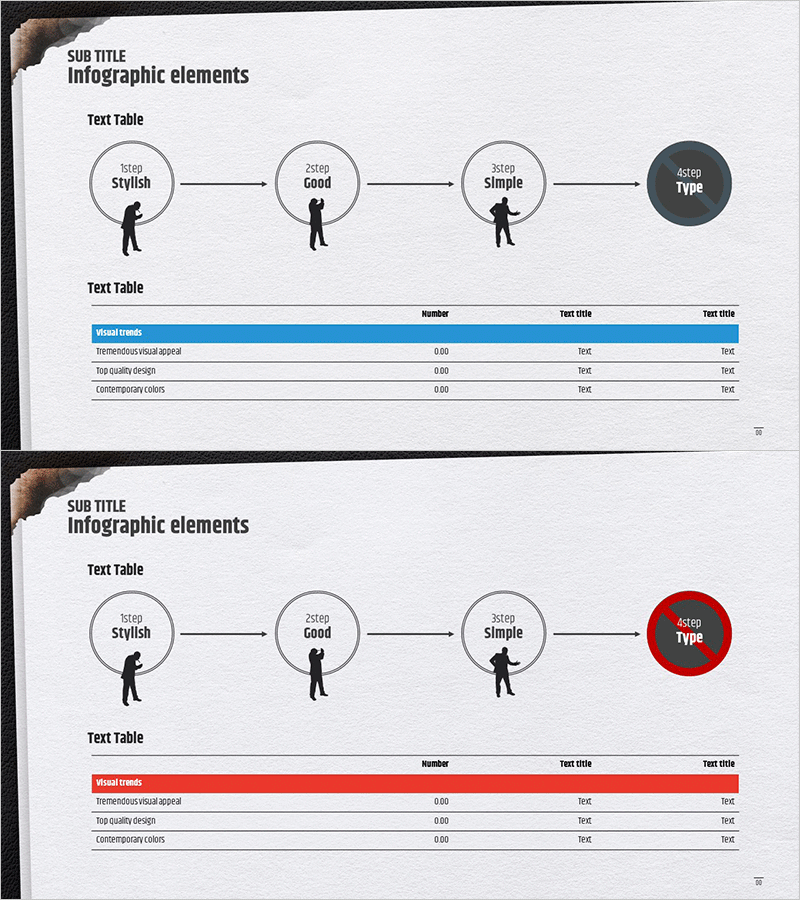
A 4-step circular process diagram PowerPoint slide designed to visualize business strategy execution, project lifecycle phases, and continuous improvement cycles. Each stage is represented as a circular node connected by directional arrows, emphasizing both linear progression and cyclical flow. Slide 1 features a dark blue accent on the final node, while Slide 2 uses red accent for alternative presentation contexts. Silhouette icons beneath each node add human element emphasis, and a data table at the bottom provides space for numerical metrics and descriptions. Delivered in 16:9 PPTX format with 2 slides, fully editable for immediate use.
Usage Points
-
Main Usage
Communicates multi-phase business strategies, project lifecycles, quality improvement cycles, and organizational change management processes through a clear 4-step circular structure. The cyclical design effectively emphasizes iterative improvement, continuous monitoring, and feedback loops essential to strategic execution.
-
How to Use
Enter stage names (1st Stylish, 2nd Good, 3rd Simple, 4th Type) into the circular nodes and populate the data table below with corresponding metrics and descriptions. Use the blue version for trust-building and positive-framed presentations, and the red version for urgency-driven or risk-focused communications. Customize colors and text to match your organization's branding guidelines.
-
Recommended For
Recommended for executives, project managers, and strategic planning teams presenting business roadmaps; quality assurance teams explaining improvement methodologies; marketing teams reporting campaign phase progress; and training professionals illustrating learning progression. Particularly effective when communicating complex 4+ stage processes in a simplified, visually coherent manner.
-
Slide Structure
Both slides share identical layout: upper section contains 4 circular nodes (approximately 80px diameter) connected by directional arrows in circular arrangement, with silhouette icons positioned below each node. Lower section provides a 3-column data table (Number, Text Title, Text Title) for metric entry. Slide 1 highlights the 4th node in dark blue; Slide 2 uses red accent to demonstrate color variation options.
Related Products
-

Table of Required Funds Plan – Effective Fund Management
#Business Strategy #Financial Plans and Performance #Diagram
-

Step-by-Step Pricing Strategy Presentation Slide
#Business Strategy #Marketing Plan and Strategy #Diagram
-

Rainbow Presentation Template Arrow Diagram 2 – Clearly Portraying Business Strategy
#Business Strategy #Financial Plans and Performance #Diagram
-

Step by Step Diagram of Playing a Musical Instrument - Fundamentals of Music
#Business Strategy #Business Management #Diagram
