Step-by-Step Pricing Strategy Presentation Slide
RM0100002_28
- Last Update 01/24/2025
- File Size 0.4MB
- # of Slides 2
- File Format PPTX
- Slide Ratio 16:9
- Color
Keywords
- #Content-Based Slides
- #Design-Based Slides
- #Business Strategy
- #Marketing Plan and Strategy
- #Diagram
- #Step-by-Step Schedule Plan
- #Pricing Strategy
- #Flow
- #Table
- #Linear Flow
- #Standard Table
- #16:9
- #5-step circular diagram PowerPoint
- #pricing strategy slide template
- #marketing plan diagram
- #process flow PPT
- #circular process diagram download
About the Product
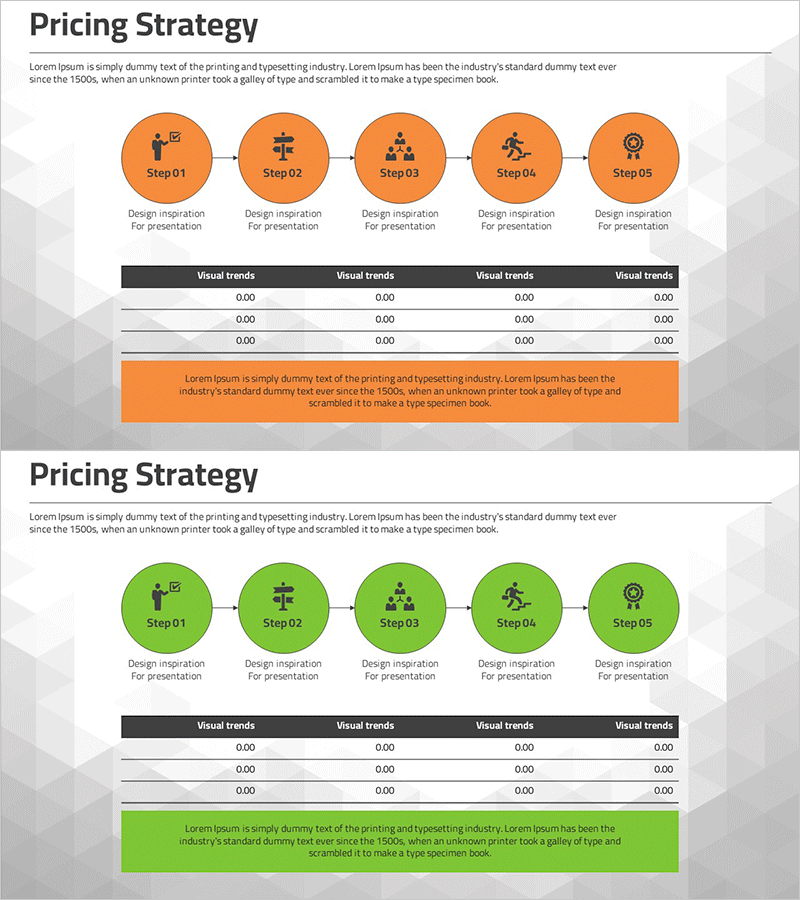
A professional PowerPoint slide featuring a 5-step circular diagram for visualizing pricing strategy processes. The design uses orange circular nodes connected by directional arrows, with design inspiration icons at each step to represent different phases of strategy development. This 2-slide template includes both the core diagram and a data table version, making it suitable for marketing presentations, business reports, and executive briefings. The 16:9 widescreen PPTX format allows immediate customization and editing.
Usage Points
-
Main Usage
Presents pricing strategy development as a clear 5-phase circular process, helping marketing teams and executives understand the strategic flow intuitively. Each step is distinguished by icons and text labels, enhancing presentation clarity and persuasiveness.
-
How to Use
Edit the text in each circular node to match your specific pricing strategy phases. Populate the data table slide with relevant metrics and timelines. Maintain the orange color scheme or customize it to match your corporate branding for visual consistency.
-
Recommended For
Marketing strategy meetings, executive pricing policy presentations, product launch pricing discussions, sales team training materials, business plan marketing strategy sections, and quarterly business reviews.
-
Slide Structure
Slide 1: Five orange circular nodes (Step01–Step05) connected by directional arrows in a cycle, with design inspiration icons and 'For presentation' labels beneath each node. Slide 2: Identical diagram layout with 'Visual trends' header and three-row data table (0.00 input fields) positioned below.
Related Products
-

Renewable Energy Project Step-by-Step Schedule – Diagram for Strategic Progress
#Business Strategy #Diagram #Step-by-Step Schedule Plan
-

Table of Required Funds Plan – Effective Fund Management
#Business Strategy #Financial Plans and Performance #Diagram
-

Smoking Cessation Progress Analysis Table Diagram – Example of Business Strategy Execution
#Business Strategy #Diagram #Step-by-Step Schedule Plan
-

Step-by-step Pricing Strategy Diagram
#Business Strategy #Marketing Plan and Strategy #Diagram
