Triangle Pattern Template with Hexagon Pie Chart
RJ0200016_5
- Last Update 04/02/2025
- File Size 6.2MB
- # of Slides 2
- File Format PPTX
- Slide Ratio 16:9
- Color
Keywords
- #Content-Based Slides
- #Design-Based Slides
- #Product/Service Introduction
- #Business Management
- #Diagram
- #Graph
- #Development Status
- #Implementation Plan
- #Flow
- #Circles
- #Linear Flow
- #Pie Chart
- #16:9
- #pie chart PowerPoint slide
- #hexagon chart template
- #data visualization presentation
- #ratio comparison slide
- #4-segment pie chart download
About the Product
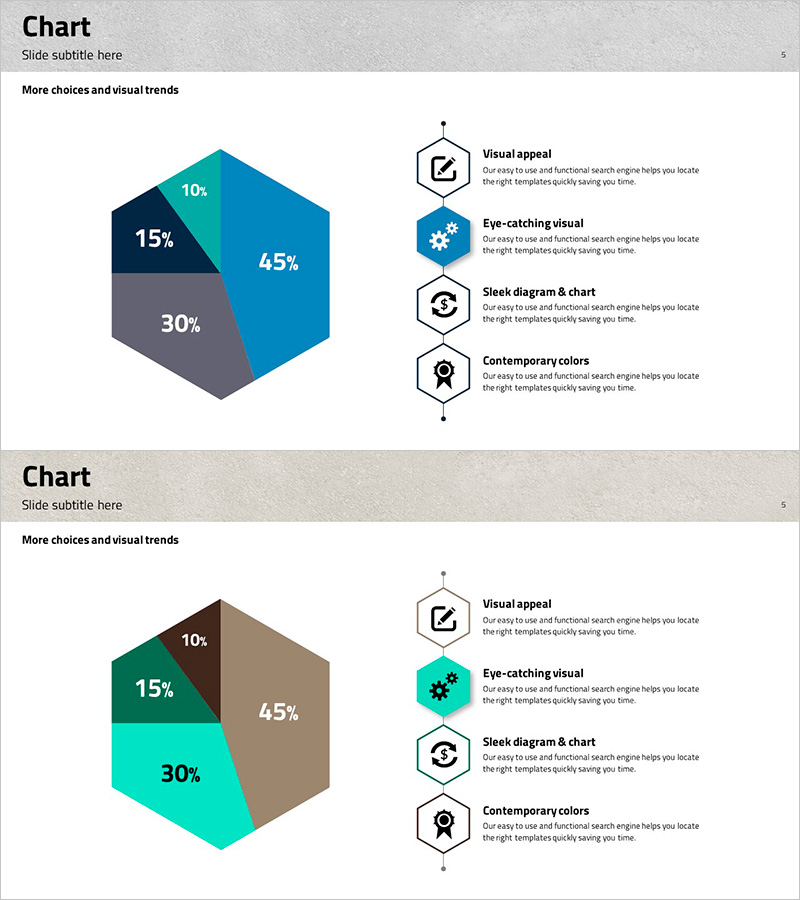
A 2-slide PowerPoint set visualizing 4-item ratio data with hexagon pie charts. Slide 1 features a multi-color hexagon pie chart (navy, turquoise, gray tones) centered on the left, with 4 hexagon icon callout boxes aligned vertically on the right for key points. Slide 2 repeats the same layout with alternate color palette (brown, green, turquoise, gray). Both slides include title and subtitle areas, ready for immediate use in data analysis and comparison presentations.
Usage Points
-
Main Usage
Communicate quantitative data ratios and composition intuitively. Ideal for comparing business performance, market share, budget allocation, or customer segments across 4 categories. The hexagon shape combined with icon callout boxes balances data credibility with visual engagement.
-
How to Use
Select slide 1 or 2 based on your presentation theme and color preference. Replace sample percentages (10%, 15%, 30%, 45%) with actual data values. Edit the 4 icon callout box titles and descriptions to match your analysis. Insert into marketing, financial, or strategy sections to support data-driven decision-making narratives.
-
Recommended For
Business plans, investor pitch decks, marketing strategy presentations, and quarterly performance reports requiring quantitative analysis. Suitable for finance teams, marketing departments, and executive audiences presenting market analysis, customer segmentation, or budget breakdowns.
-
Slide Structure
Slide 1: Title area + centered hexagon pie chart (4 segments in navy, turquoise, gray, navy) + 4 hexagon icon callout boxes (vertical alignment, right side). Slide 2: identical layout with alternate color scheme (brown, green, turquoise, gray). 16:9 widescreen format, PPTX file, 2-slide composition.
Related Products
-

Clock Shape Circular Diagram – Product and Market Analysis
#Product/Service Introduction #Market and Competitor Analysis #Graph
-

3-Step Main System Configuration Diagram – Business Strategy
#Business Strategy #Business Management #Diagram
-

Step by Step Diagram of Playing a Musical Instrument - Fundamentals of Music
#Business Strategy #Business Management #Diagram
-

Development Status Analysis Circle Graph
#Product/Service Introduction #Market and Competitor Analysis #Graph
