Clock Shape Circular Diagram – Product and Market Analysis
RJ0300054_10
- Last Update 05/02/2025
- File Size 2.9MB
- # of Slides 2
- File Format PPTX
- Slide Ratio 16:9
- Color
Keywords
- #Content-Based Slides
- #Design-Based Slides
- #Product/Service Introduction
- #Market and Competitor Analysis
- #Graph
- #Development Status
- #Market Analysis
- #Circles
- #Pie Chart
- #16:9
- #clock-shaped pie chart PowerPoint
- #circular chart slide template
- #2-segment ratio visualization
- #pie chart presentation template
- #business analysis chart slide
- #how to create pie chart in PowerPoint
About the Product
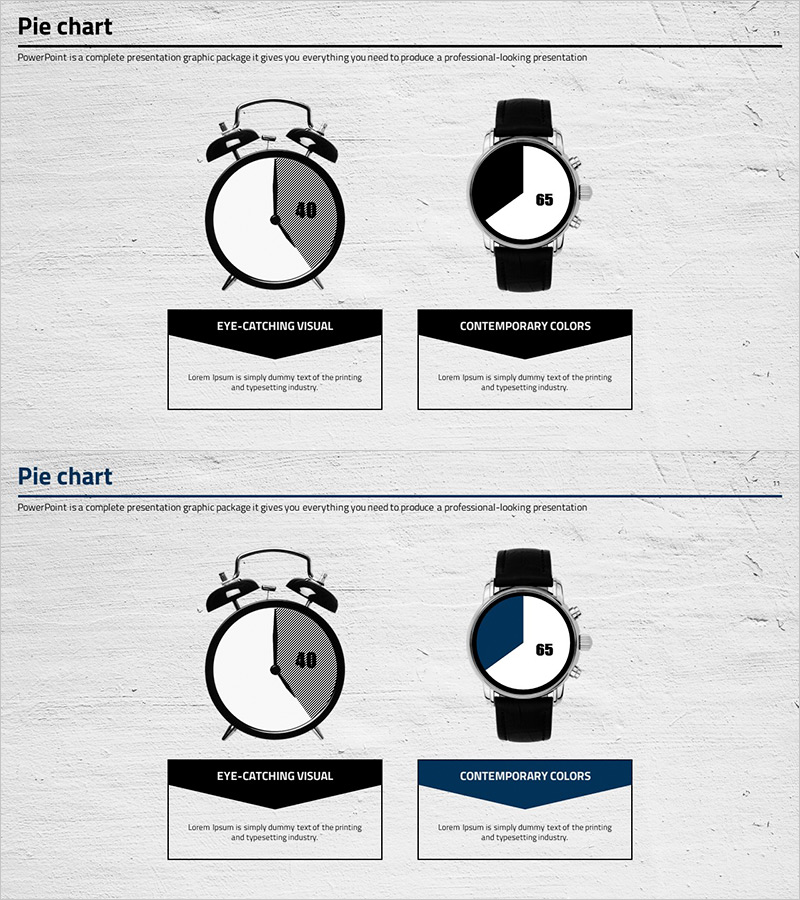
A distinctive clock-shaped pie chart PowerPoint slide set featuring 2 slides in black-and-white and navy accent versions. Designed for product analysis, market share visualization, and time-based ratio representation. Each slide combines a 2-segment circular chart with a clock-shaped icon to intuitively convey time progression, process stages, and comparative ratios. Delivered in 16:9 widescreen PPTX format, fully editable and ready for immediate use in business presentations, analytical sections, and data-driven reports.
Usage Points
-
Main Usage
Visualizes product market share, time-based ratios, and process stage distribution. The combination of clock icon and circular chart enables simultaneous representation of time progression, sequential stages, and comparative ratios, making it ideal for marketing analysis, business performance reports, and product introduction materials.
-
How to Use
Replace the displayed figures (40, 65, etc.) with your own data and edit the text box descriptions. Use the black-and-white version for printed materials and formal reports; apply the navy accent version for screen presentations and digital assets. Customize the color palette to match your company brand guidelines.
-
Recommended For
Marketing managers, business planners, financial analysts, and product managers explaining market analysis, sales performance, customer composition, and budget allocation. Effective for startup investor pitches, quarterly performance reviews, and product launch presentations where data-driven decision-making is emphasized.
-
Slide Structure
Each slide features a clock-shaped circular chart on the left (2 segments with hatching on one section) and a watch mockup-style circular chart on the right (2 segments with color emphasis). Below are labeled text boxes for 'EYE-CATCHING VISUAL' and 'CONTEMPORARY COLORS' providing description areas. Layout optimized for 16:9 aspect ratio.
Related Products
-

Pie Chart Slide for Status of Service Technology Development
#Product/Service Introduction #Market and Competitor Analysis #Graph
-

Market Share Analysis Area & Pie Chart – The Power of Data Visualization
#Product/Service Introduction #Market and Competitor Analysis #Graph
-

Medical Analysis Pie Chart – Visualization of Market Trends
#Product/Service Introduction #Market and Competitor Analysis #Graph
-

Manufacturing Analysis Graph – Market and Competitive Analysis
#Product/Service Introduction #Market and Competitor Analysis #Graph
