Development Status Analysis Circle Graph
RJ0300045_6
- Last Update 04/30/2025
- File Size 0.7MB
- # of Slides 2
- File Format PPTX
- Slide Ratio 16:9
- Color
Keywords
- #Content-Based Slides
- #Design-Based Slides
- #Product/Service Introduction
- #Market and Competitor Analysis
- #Graph
- #Development Status
- #Market Share
- #Circles
- #Pie Chart
- #16:9
- #pie chart PowerPoint slide
- #pie graph template
- #market share analysis chart
- #development status visualization
- #data representation slide
- #how to create pie chart in PowerPoint
About the Product
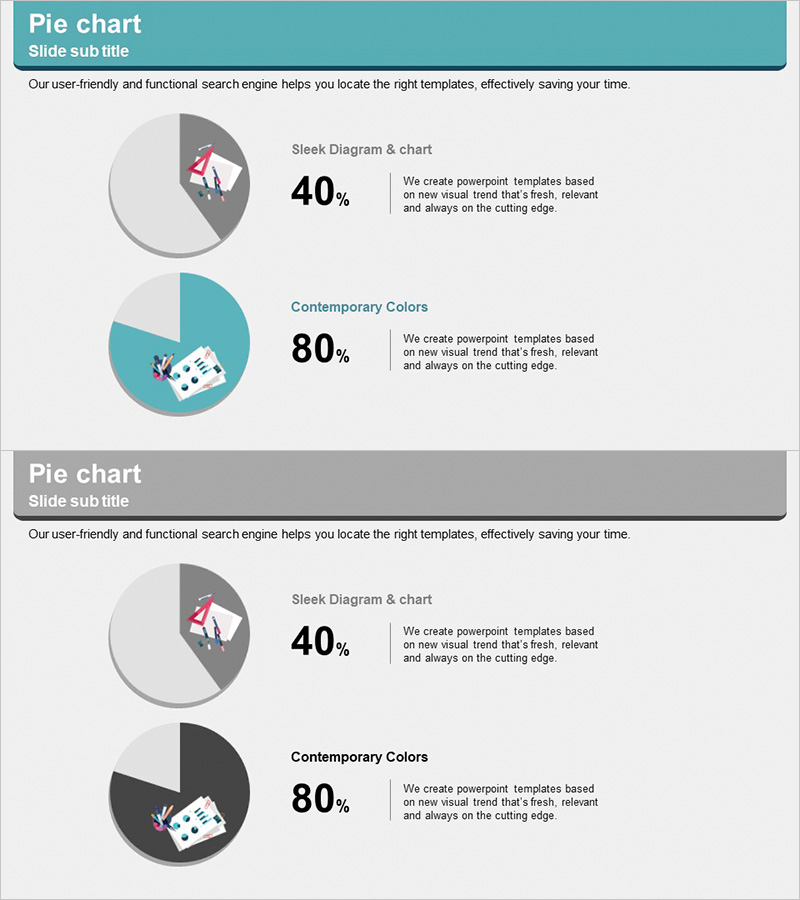
A 2-slide pie chart PowerPoint template designed to compare development progress and market share at a glance. The first slide features a minimalist gray-tone design highlighting development completion rate (40%), while the second slide uses a teal background with contrasting colors to visualize market share (80%). Each chart includes accompanying icons and descriptive text boxes for clear data interpretation. Available in 16:9 widescreen PPTX format, fully editable and ready for immediate use in business presentations and reports.
Usage Points
-
Main Usage
Clearly express the relationship between whole and parts using circular charts for development rates, market share, composition ratios, and other proportional data. Effectively communicates key metrics to executives, investors, and stakeholders in reports and presentations.
-
How to Use
Double-click the pie chart values and labels on each slide to update with your actual data. The accompanying icons and text boxes are fully editable; adjust the color palette to match your company branding. Optimized for widescreen 16:9 display format.
-
Recommended For
Executive reports, investor pitch decks, marketing analysis presentations, business status updates, market research findings, quarterly and annual performance reviews. Ideal for finance, IT, manufacturing, and retail sectors requiring data-driven presentations.
-
Slide Structure
Slide 1: Gray-tone background with 40% pie chart (2-segment), left-aligned icon, right-aligned text description / Slide 2: Teal-tone background with 80% pie chart (2-segment), left-aligned icon, right-aligned text description. Both slides maintain consistent layout optimized for comparative analysis.
Related Products
-

Market Share Circle Pie Chart
#Product/Service Introduction #Market and Competitor Analysis #Graph
-

Construction Development Status Chart – Key to Construction Market Analysis
#Product/Service Introduction #Market and Competitor Analysis #Graph
-

Space Illustration Theme Circle Graph
#Product/Service Introduction #Market and Competitor Analysis #Graph
-

4 Donut Charts for Data Visualization – Easy Presentation Template
#Product/Service Introduction #Market and Competitor Analysis #Graph
