Step by Step Diagram of Playing a Musical Instrument - Fundamentals of Music
RJ0500020_16
- Last Update 06/12/2025
- File Size 0.5MB
- # of Slides 2
- File Format PPTX
- Slide Ratio 16:9
- Color
Keywords
- #Content-Based Slides
- #Design-Based Slides
- #Business Strategy
- #Business Management
- #Diagram
- #Step-by-Step Schedule Plan
- #Implementation Plan
- #Flow
- #Table
- #Linear Flow
- #Standard Table
- #16:9
- #circular diagram PowerPoint
- #step-by-step process slide
- #4-step diagram template
- #music education presentation
- #process flow chart PowerPoint
About the Product
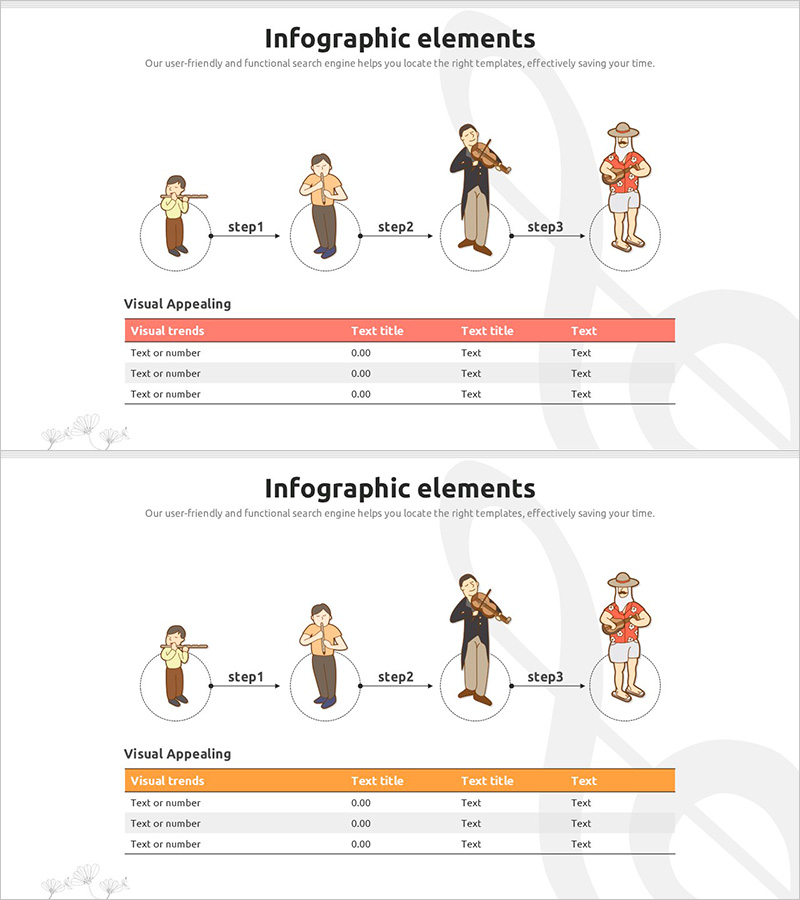
A PowerPoint slide that visualizes the step-by-step process of learning to play a musical instrument using a 4-node circular diagram structure. Each stage features character illustrations arranged in a circular layout to show the learning progression, with a data table below to organize detailed information for each step. This presentation slide is ideal for music education, instrument lessons, skill development training, and any sequential learning content. The 16:9 widescreen format includes 2 slides ready for immediate editing and customization.
Usage Points
-
Main Usage
Visually represent the sequential learning journey from beginner to advanced levels in musical instrument training, with a structured table format to organize key information for each stage and enhance learner comprehension.
-
How to Use
Use in music classes, instrument lessons, and online education platforms to explain learning progression. Follow the circular arrows through each stage while editing the table content to adapt the template for other processes such as technical skill development or business implementation phases.
-
Recommended For
Music instructors, educational institutions, online course creators, technical trainers, and presenters who need process-based educational materials. Particularly effective for beginner-level learning resource development and skill progression visualization.
-
Slide Structure
Slide 1: 4-node circular diagram with circular arrangement + 4 character illustrations + step labels (step1–step3) + connecting arrows. Slide 2: Header row (coral color) + 3 data rows + 4 columns (Visual trends, Text title, Text title, Text) information table layout.
Related Products
-

Annual Schedule Plan Slide – Clear Roadmap for Business Execution
#Business Strategy #Business Management #Diagram
-

Linear Diagram for Business Strategy Visualization – Step-by-Step Planning
#Business Strategy #Business Management #Diagram
-

Mobile App Step-by-Step Schedule Planning Diagram
#Business Strategy #Business Management #Diagram
-

Color Theme Template Sequence Diagram – Business Strategy Execution
#Business Strategy #Business Management #Diagram
