Linear Flow Diagram for Propulsion Strategy Plan
RB0800018_5
- Last Update 03/21/2025
- File Size 0.1MB
- # of Slides 2
- File Format PPTX
- Slide Ratio 4:3
- Color
Keywords
About the Product
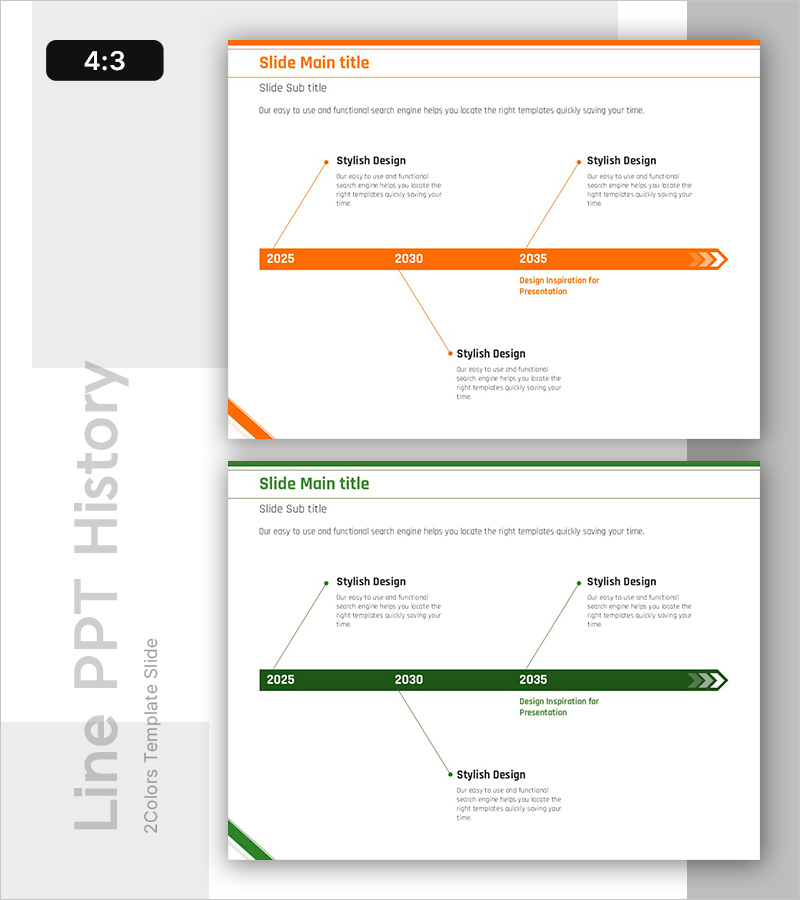
A linear flow diagram PowerPoint slide designed for propulsion strategy planning and roadmap visualization. This template connects three key milestones (2025, 2030, 2035) using an orange arrow-based diagram structure, enabling clear representation of stage-by-stage objectives and action items. The orange accent color contrasts effectively against the gray background for enhanced visual clarity, while geometric decorative shapes in the top-left and bottom-left corners maintain presentation consistency. Ideal for strategy presentations, business plans, progress reports, and project timelines that require temporal progression visualization.
Usage Points
-
Main Usage
Optimized for visualizing year-by-year and stage-by-stage strategy implementation and planning processes. The three-point linear arrow structure clearly illustrates temporal progression toward goal achievement, while providing dedicated text areas for adding stage-specific details and supporting information.
-
How to Use
Input the relevant years or quarters at each milestone point (2025, 2030, 2035), then populate the 'Stylish Design' text boxes on the upper left and right with key objectives for each stage. Complete the description area at the bottom with execution strategies and expected outcomes to present a clear roadmap to your audience.
-
Recommended For
Ideal for executives, strategy managers, and project leads presenting business plans, strategic reports, and investment pitch decks. Particularly effective for communicating mid-to-long-term implementation roadmaps, organizational vision realization timelines, and new business expansion strategies.
-
Slide Structure
Two-slide template featuring an orange arrow-based linear diagram connecting three temporal points. Each slide includes two text input areas in the upper corners and one additional description zone below the central arrow, providing three distinct information points. Compatible with all standard 4:3 projector environments.
Related Products
-

Achievements Timeline Diagram – Business Vision and Strategy
#Company Introduction #Business Vision and Strategy #Diagram
-

Arrow Connection History Diagram – Step-by-Step Business Strategy
#Company Introduction #Business Strategy #Diagram
-

Fintech Business History Diagram – Effective Information Delivery
#Company Introduction #Diagram #History
-

Business Plan History Diagram – Stepwise Flow Representation
#Company Introduction #Business Strategy #Diagram
