Diagram Introducing the History of All Time – Business Growth and Development
RM0500010_6
- Last Update 02/23/2025
- File Size 0.4MB
- # of Slides 2
- File Format PPTX
- Slide Ratio 16:9
- Color
Keywords
- #Content-Based Slides
- #Design-Based Slides
- #Company Introduction
- #Business Strategy
- #Diagram
- #History
- #Step-by-Step Schedule Plan
- #Flow
- #Cluster
- #Linear Flow
- #Chain Diagram
- #16:9
- #timeline diagram PowerPoint
- #history slide template
- #connected diagram presentation
- #4-stage timeline slide
- #company growth process PowerPoint
- #chronological milestone diagram
About the Product
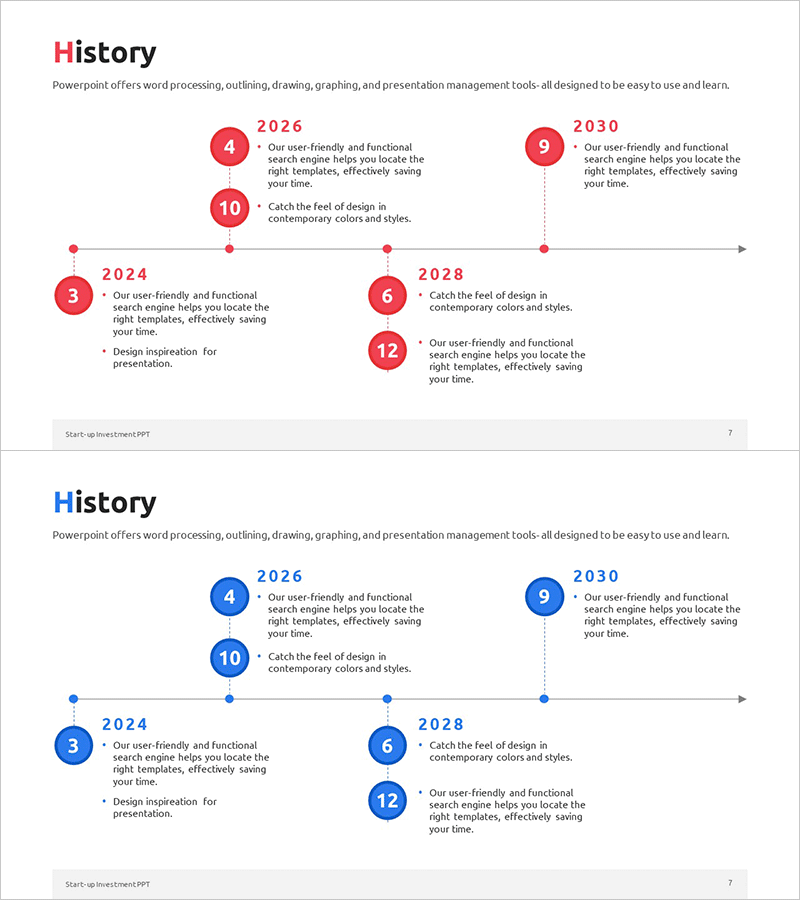
A timeline history PowerPoint slide that presents your company's development journey in chronological order. This presentation template features four key milestones from 2024 to 2030, connected by a horizontal axis with circular nodes and linking lines that intuitively convey business growth stages. Available in two color versions—red and blue—each node accommodates year labels and descriptive text for flexibility. Perfect for company overview presentations, business plans, and annual reports, this slide design effectively visualizes organizational history and development trajectory to stakeholders.
Usage Points
-
Main Usage
Visualize organizational history, key milestones, and business growth stages in chronological sequence to clearly communicate your company's development trajectory to stakeholders. Ideal for company overview and annual reports to emphasize organizational credibility and sustained growth.
-
How to Use
Enter the year in each circular node and add corresponding achievements or events in the text area below. Select your preferred color version to match corporate branding, and customize by adjusting node count or modifying connecting lines as needed for your presentation context.
-
Recommended For
Executive and investor presentations / New employee onboarding and corporate culture training / Business performance reporting and future vision statements / Corporate promotional materials and website company profiles / Consulting reports explaining organizational change and evolution
-
Slide Structure
Horizontal timeline axis with four circular nodes (2024, 2026, 2028, 2030) positioned along the line. Text description areas are placed above and below each node. Nodes are connected by a continuous line, with red and blue color versions available. Consists of 2 slides total.
Related Products
-

Business Plan History Diagram – Stepwise Flow Representation
#Company Introduction #Business Strategy #Diagram
-

Social Media Linear Diagram – Stages of Business Growth
#Company Introduction #Business Strategy #Diagram
-

Arrow Connection History Diagram – Step-by-Step Business Strategy
#Company Introduction #Business Strategy #Diagram
-

Business Direction Illustrated with Camping Infographic
#Business Strategy #Diagram #Step-by-Step Schedule Plan
