Fintech Business History Diagram – Effective Information Delivery
RJ0400058_8
- Last Update 06/02/2025
- File Size 0.2MB
- # of Slides 2
- File Format PPTX
- Slide Ratio 16:9
- Color
Keywords
About the Product
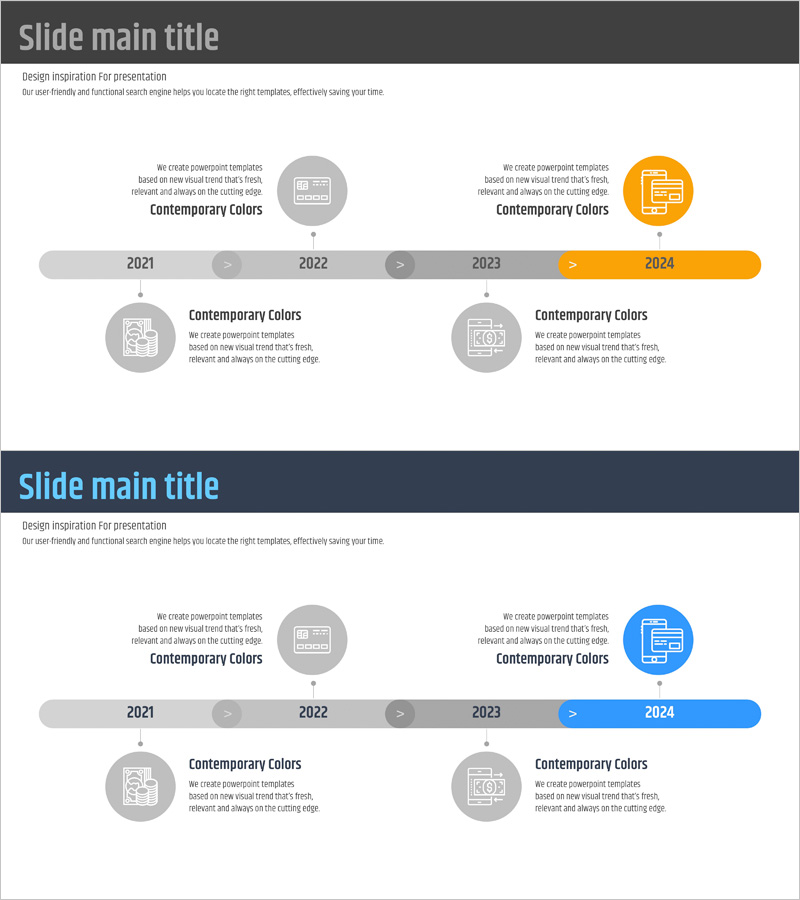
A horizontal timeline connection diagram PowerPoint slide visualizing business milestones from 2021 to 2024. Four year nodes are linked sequentially with arrows, each featuring circular icons and text areas for effective information delivery. The design uses a gray background with gold accent color highlighting the current year (2024), creating clear temporal flow. Ideal for fintech, financial services, and IT companies presenting development history, product launches, organizational growth, and business achievements in investor presentations and corporate overview decks.
Usage Points
-
Main Usage
Visualize year-by-year business milestones, product launches, organizational growth stages, and key events in chronological order. Each node accommodates icons and descriptive text, enabling audiences to grasp timeline sequence and major achievements intuitively.
-
How to Use
Enter milestone details, product information, or achievement summaries in each year's text area. Customize icons and adjust colors to match your brand identity. Apply to investor pitch decks, corporate overview presentations, annual reports, and business development timelines.
-
Recommended For
Finance, fintech, and IT company executives preparing investor relations materials, corporate introductions, and business reports. Startup founders explaining growth trajectory, enterprises showcasing key accomplishments, and product managers presenting development roadmaps. Suitable for board presentations and employee onboarding materials.
-
Slide Structure
Two-slide layout. Header with 'Slide main title' section. Central horizontal timeline with four connected nodes (2021, 2022, 2023, 2024) linked by directional arrows. Each node contains a circular icon and 'Contemporary Colors' text block. Year 2024 highlighted in gold to emphasize current status. Additional description area positioned below timeline.
Related Products
-

Linear Flow Diagram for Propulsion Strategy Plan
#Company Introduction #Diagram #History
-

Adventure Company History 4 Color Connection Diagram
#Company Introduction #Business Strategy #Diagram
-

Diagram Introducing the History of All Time – Business Growth and Development
#Company Introduction #Business Strategy #Diagram
-

History Vertical Arrow Diagram – Business Flow Visualization
#Company Introduction #Diagram #History
