Mobile Finance Presentation Template – Stylish Design for Financial Insights
J0400066
- Last Update 08/28/2025
- File Size 34.3MB
- # of Slides 20
- File Format PPTX
- Slide Ratio 16:9
- Color
Slide Preview


Keywords
About the Product
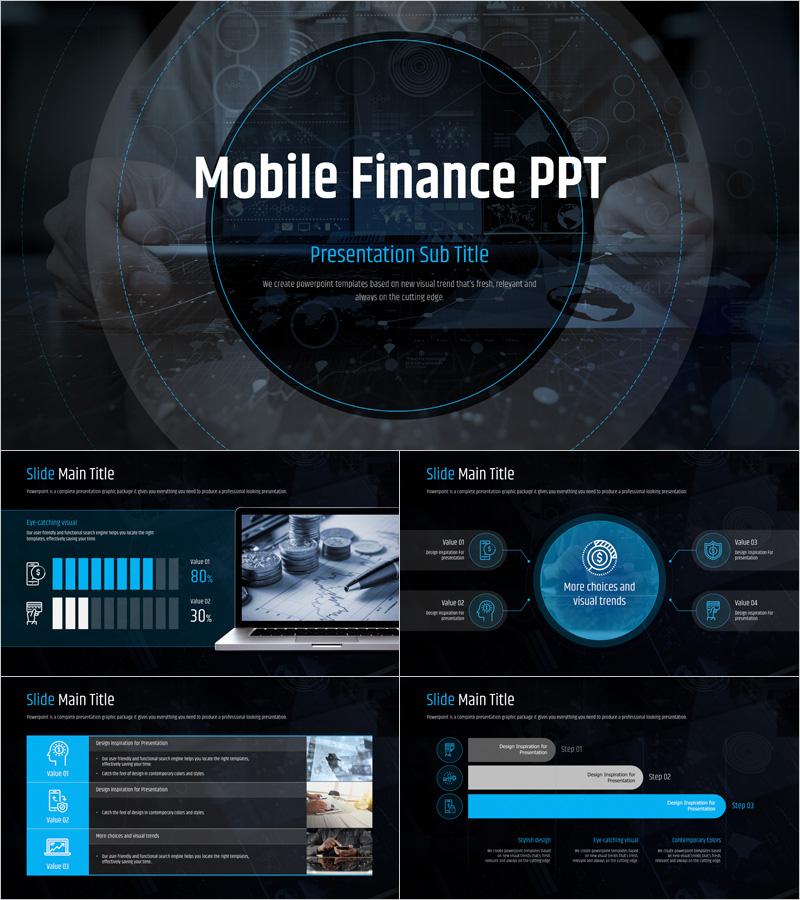
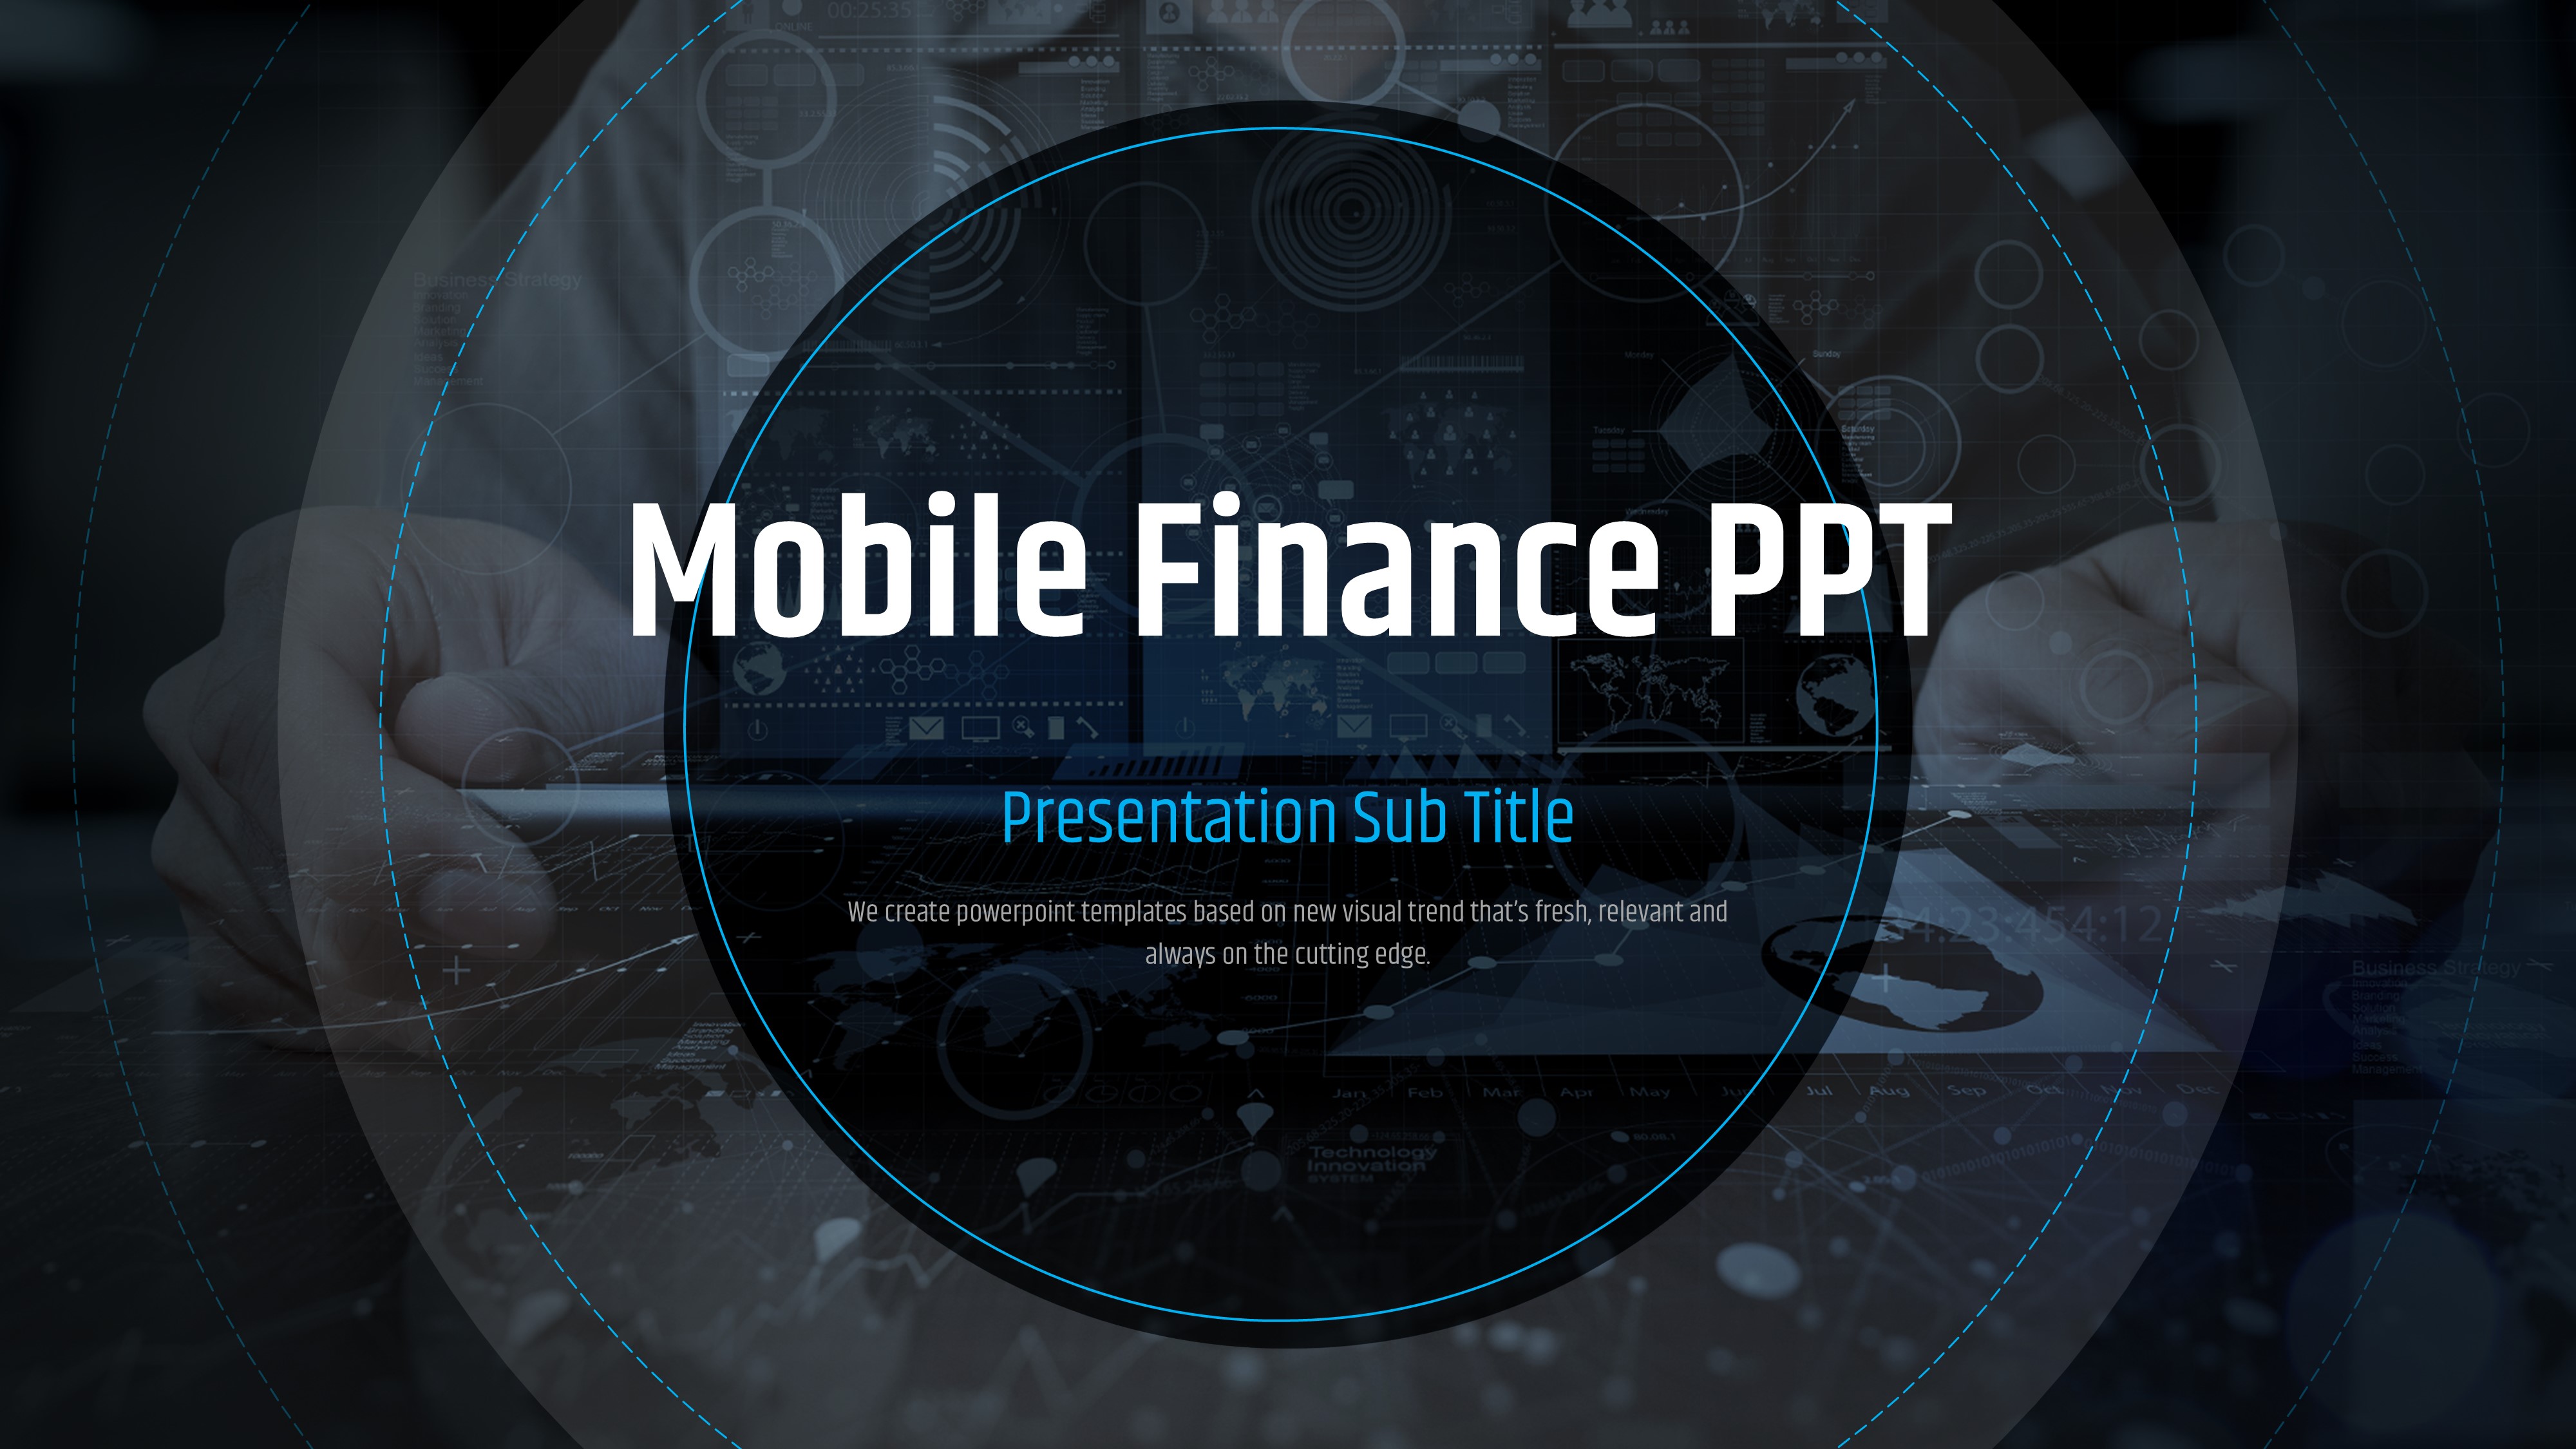
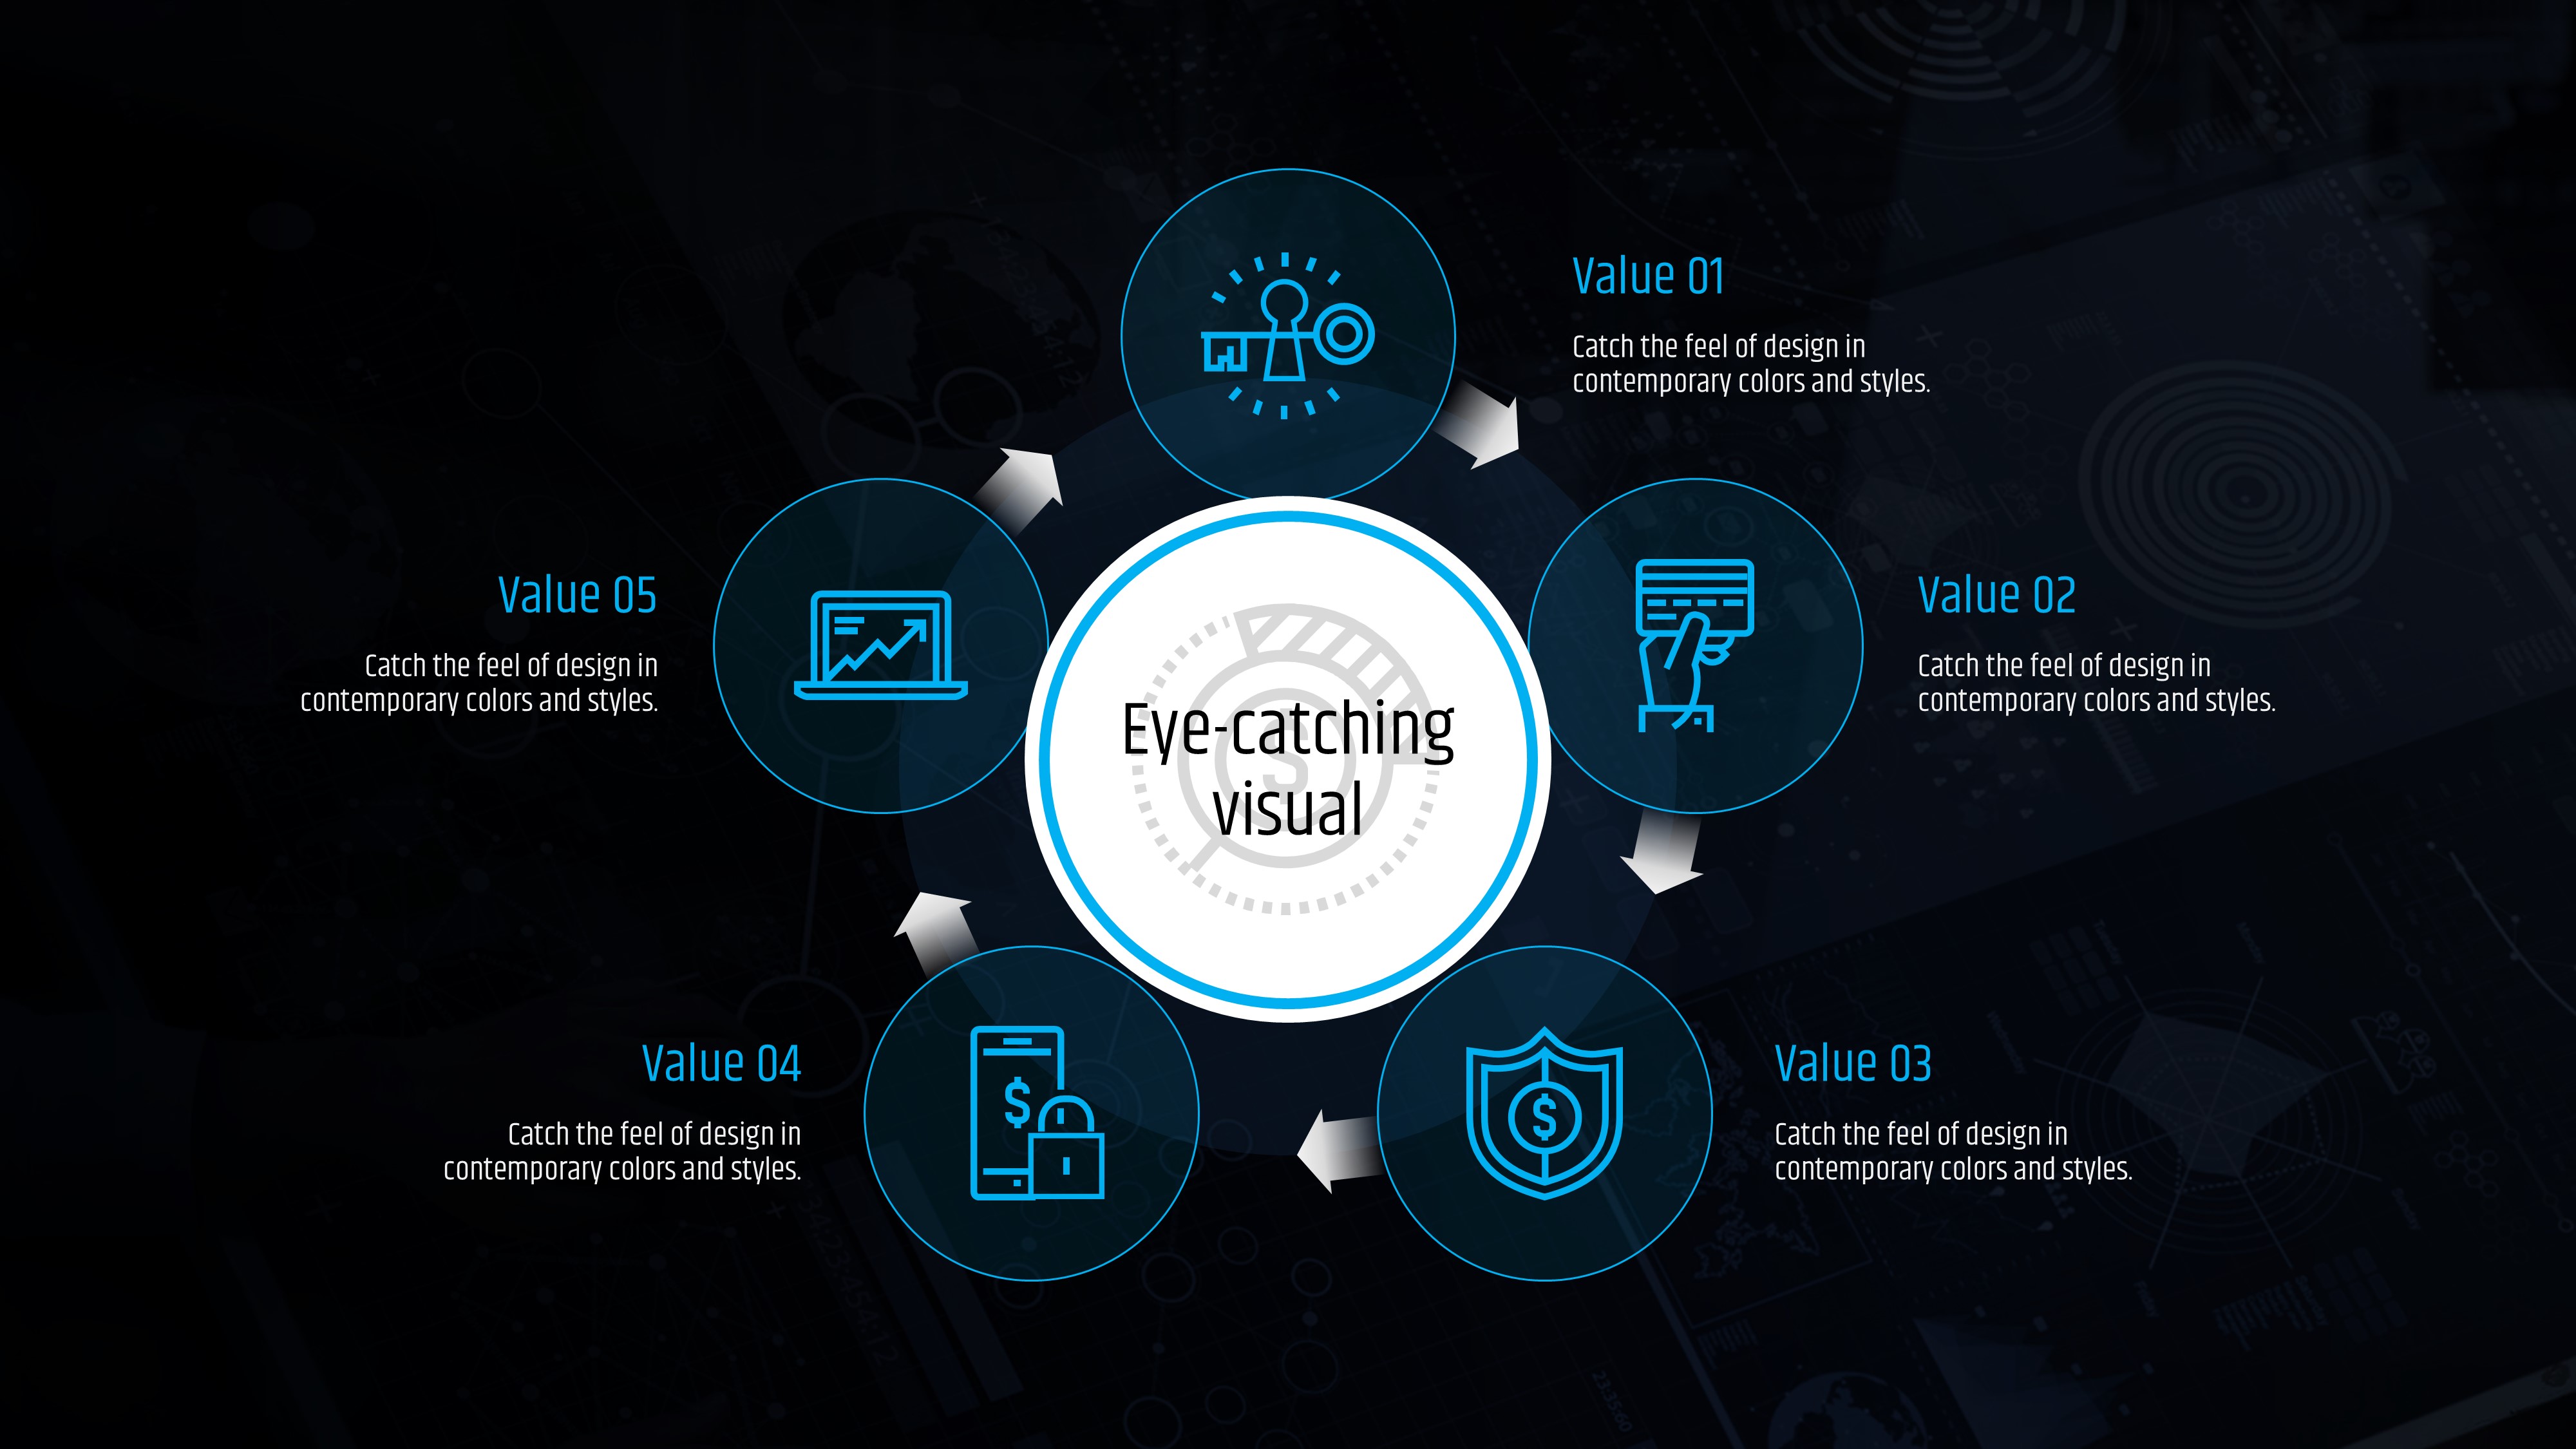
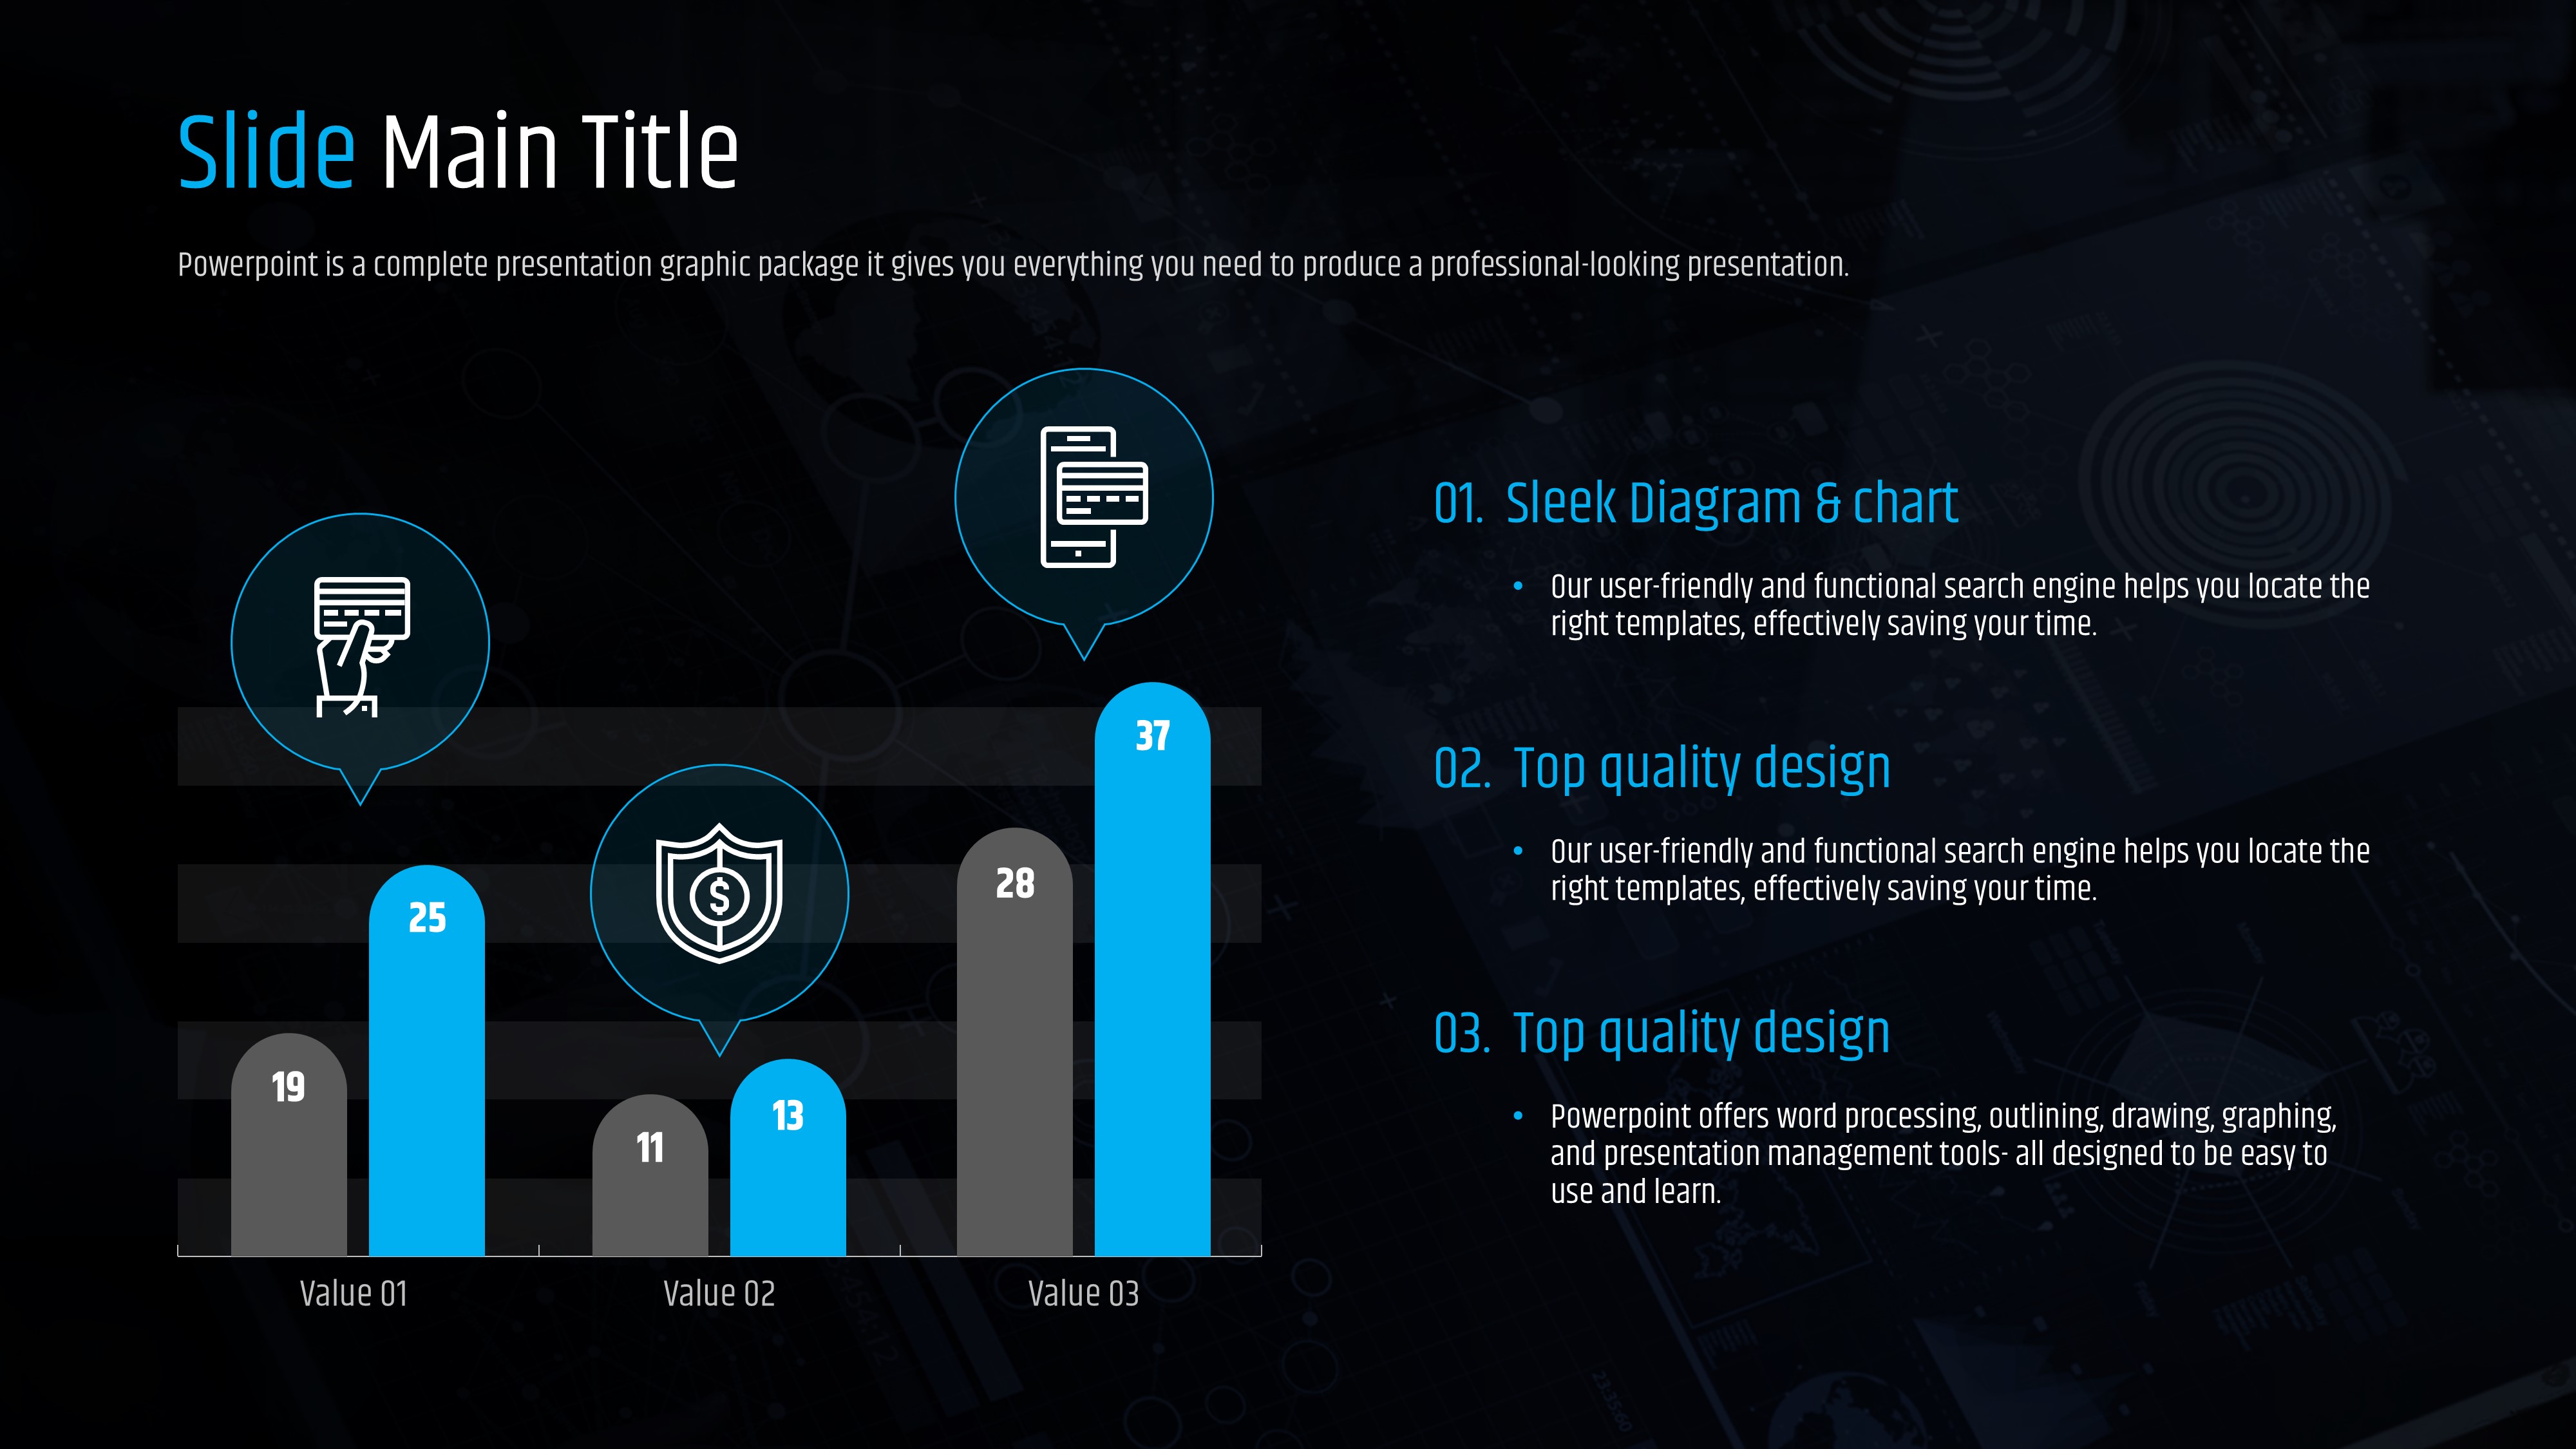
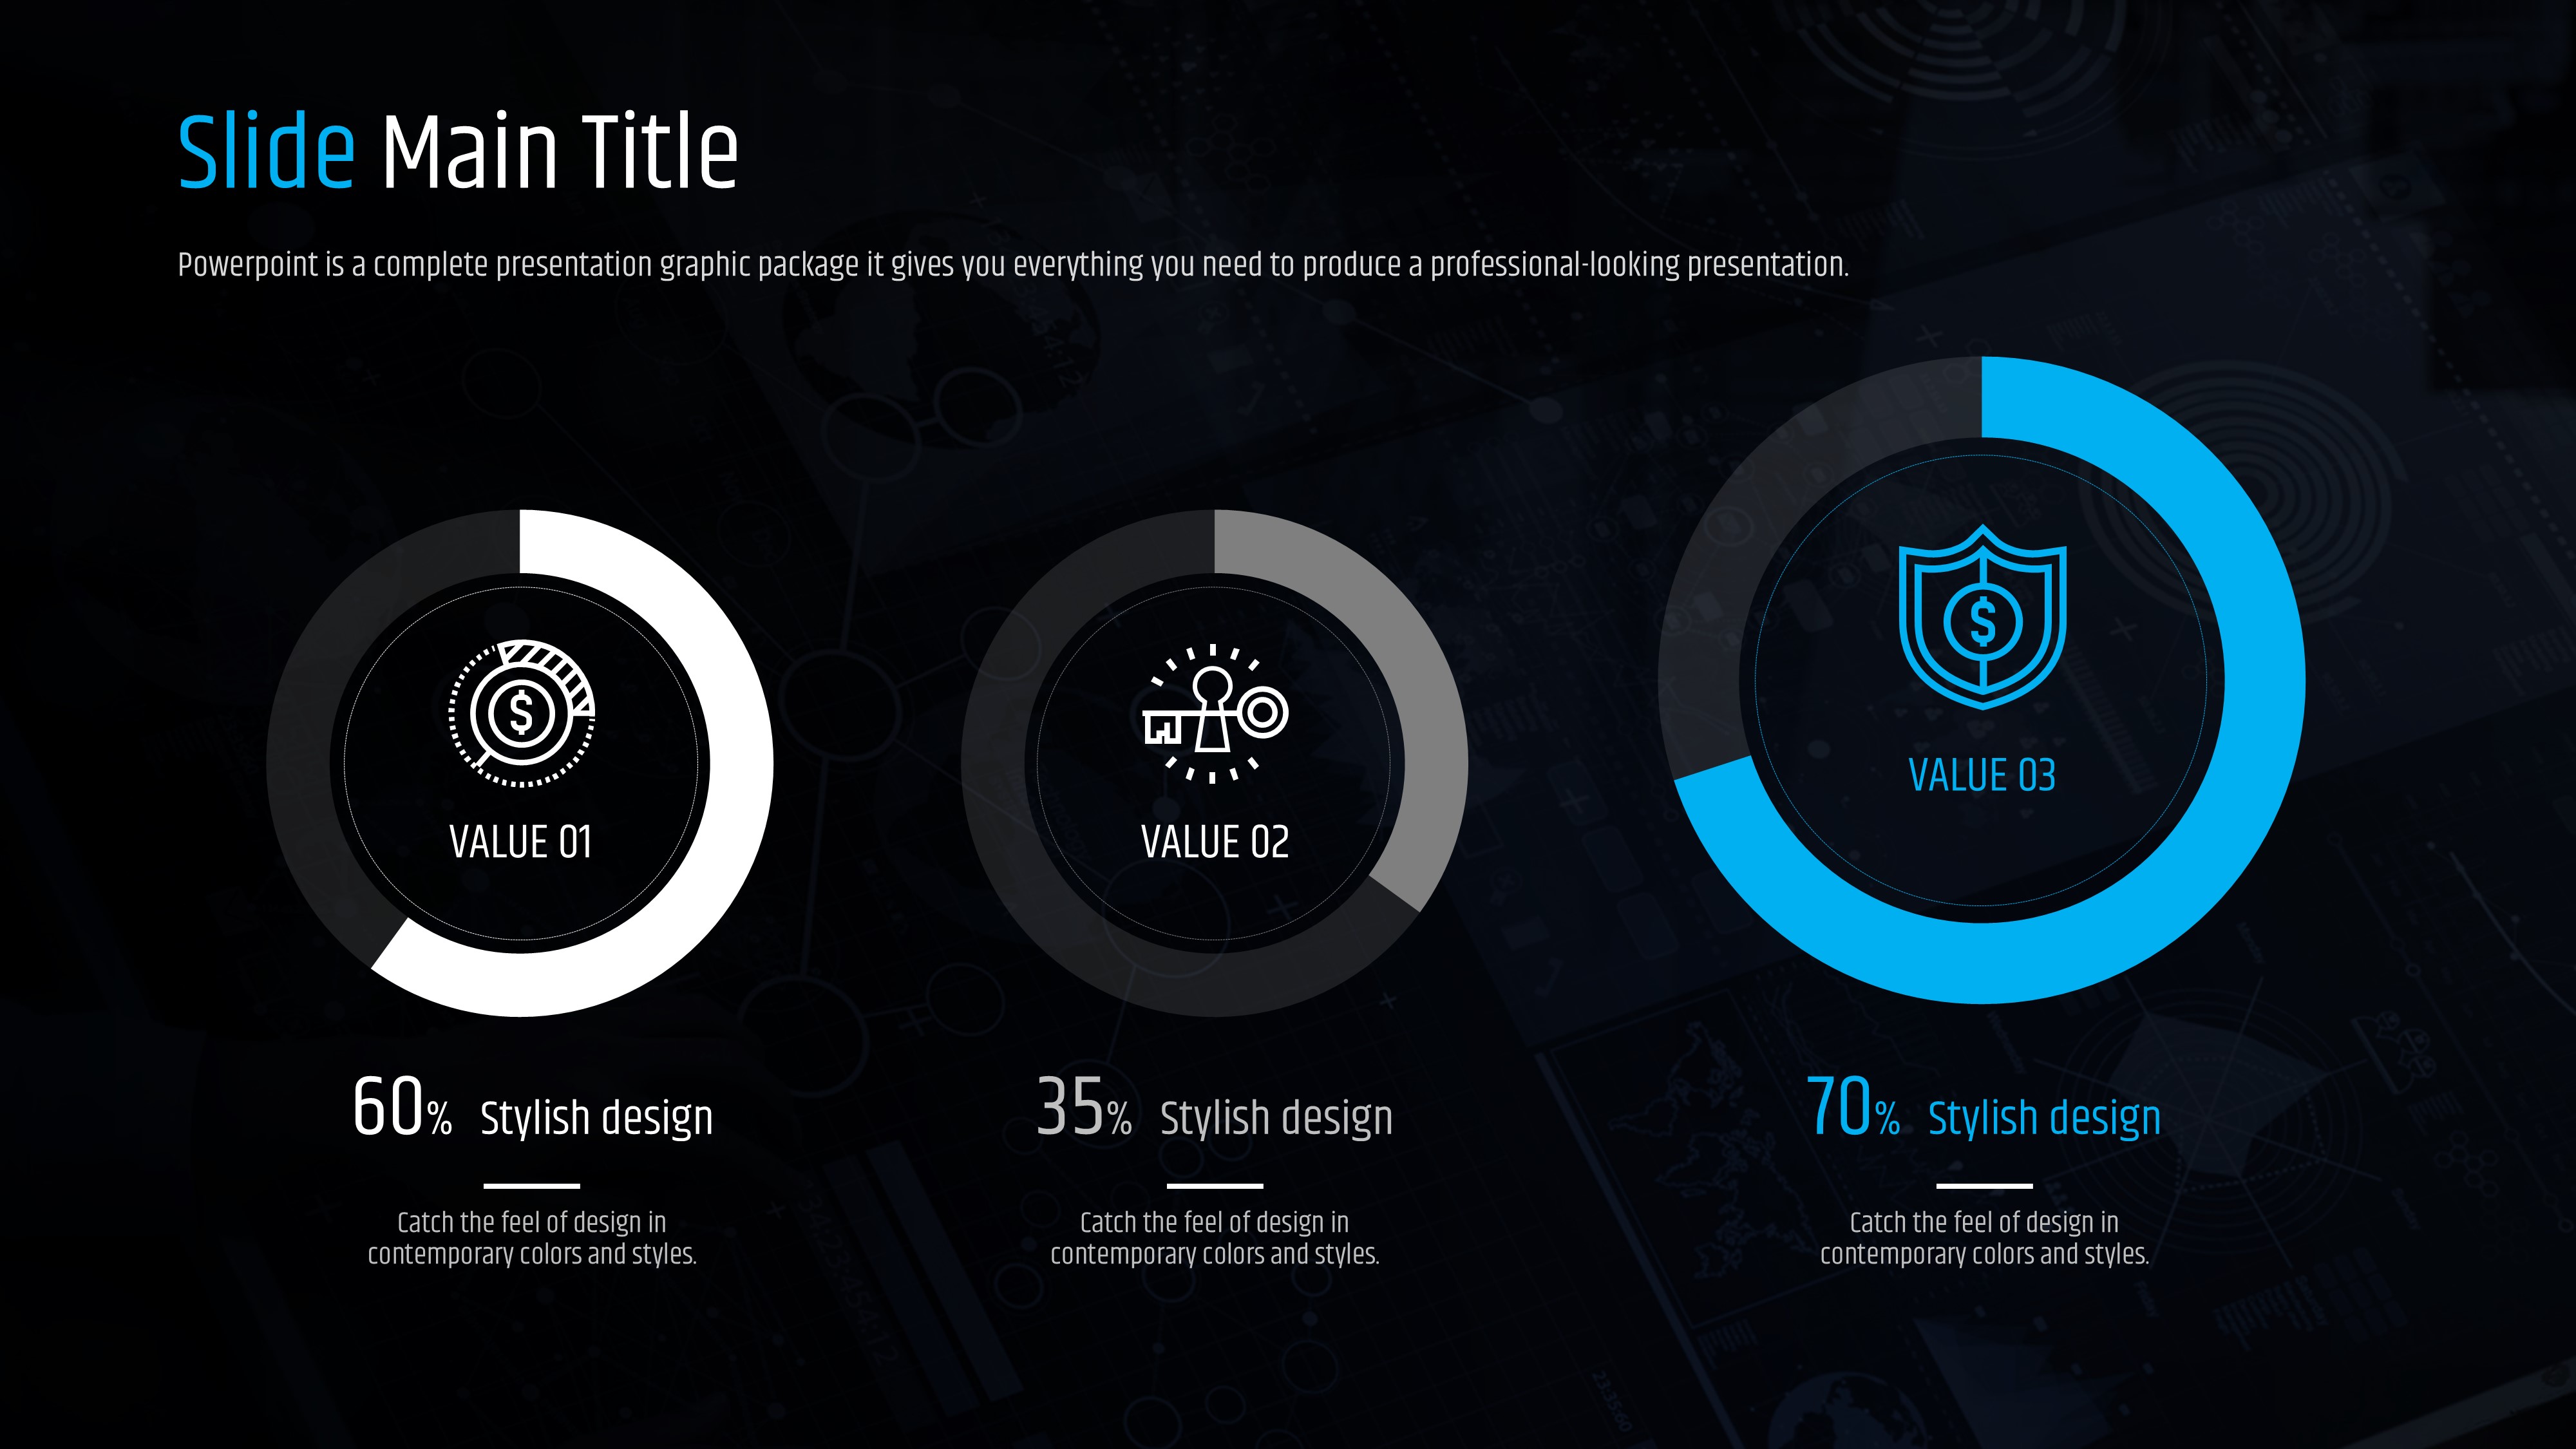
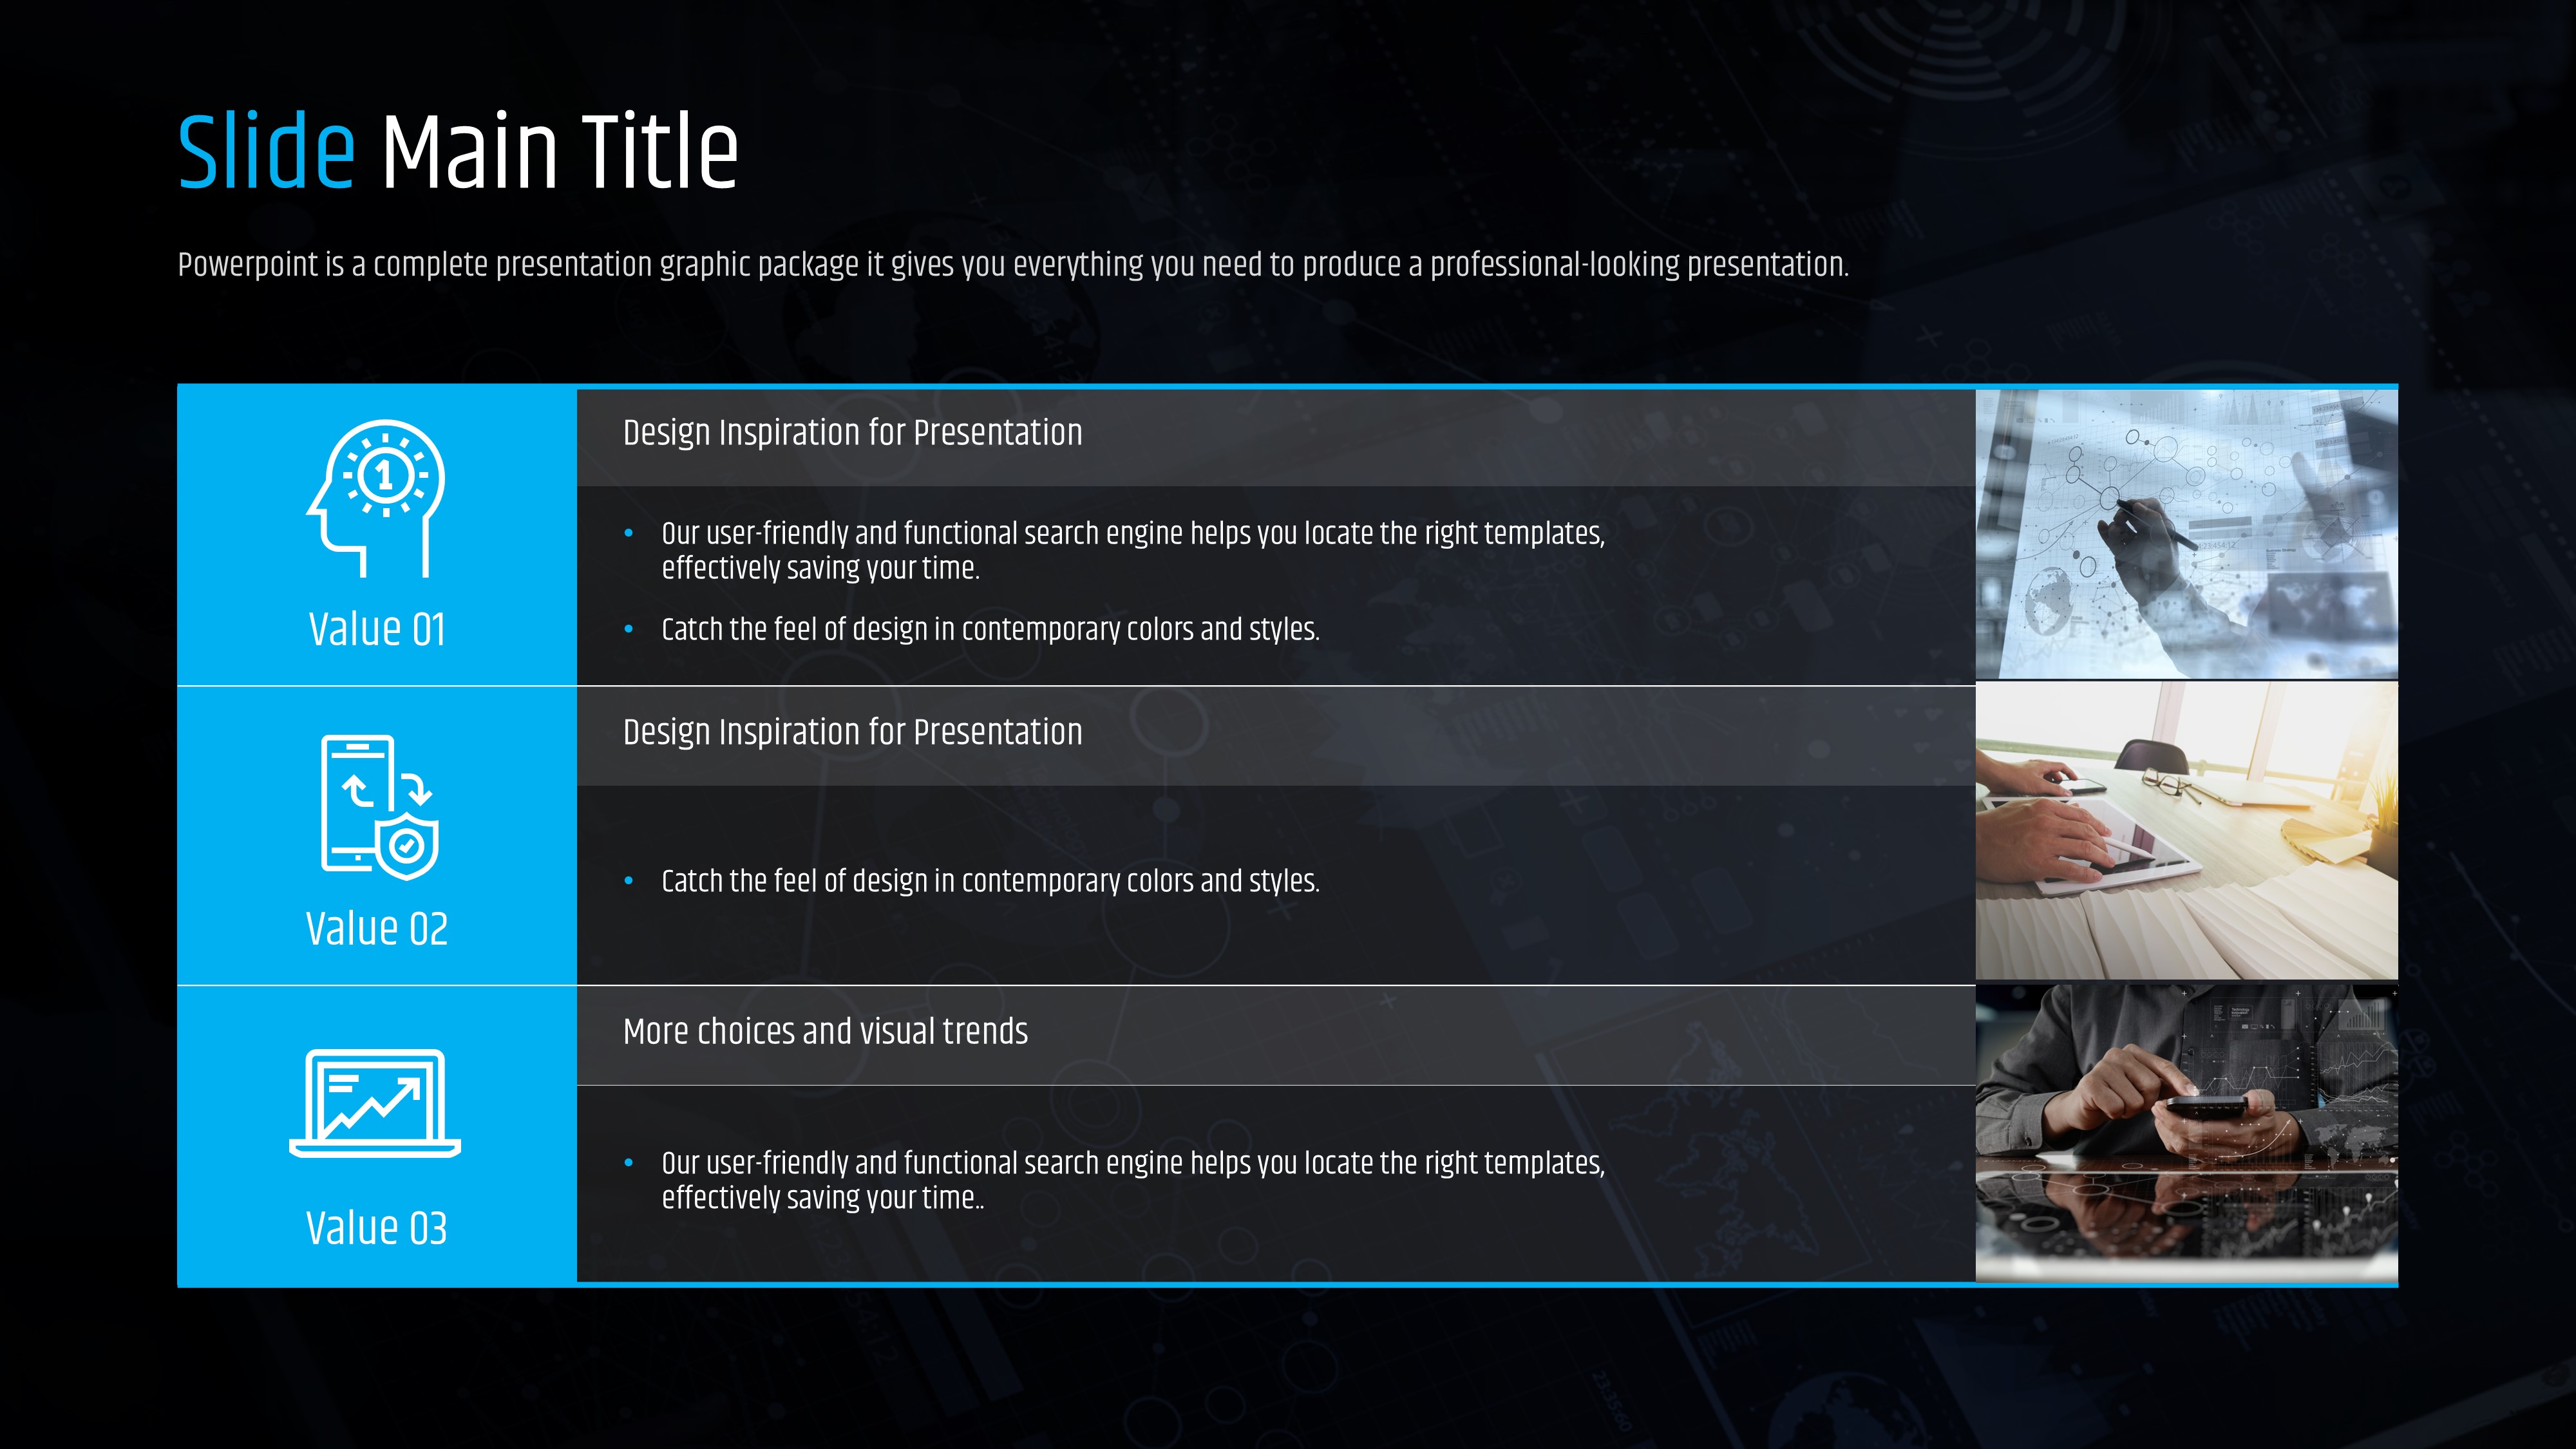
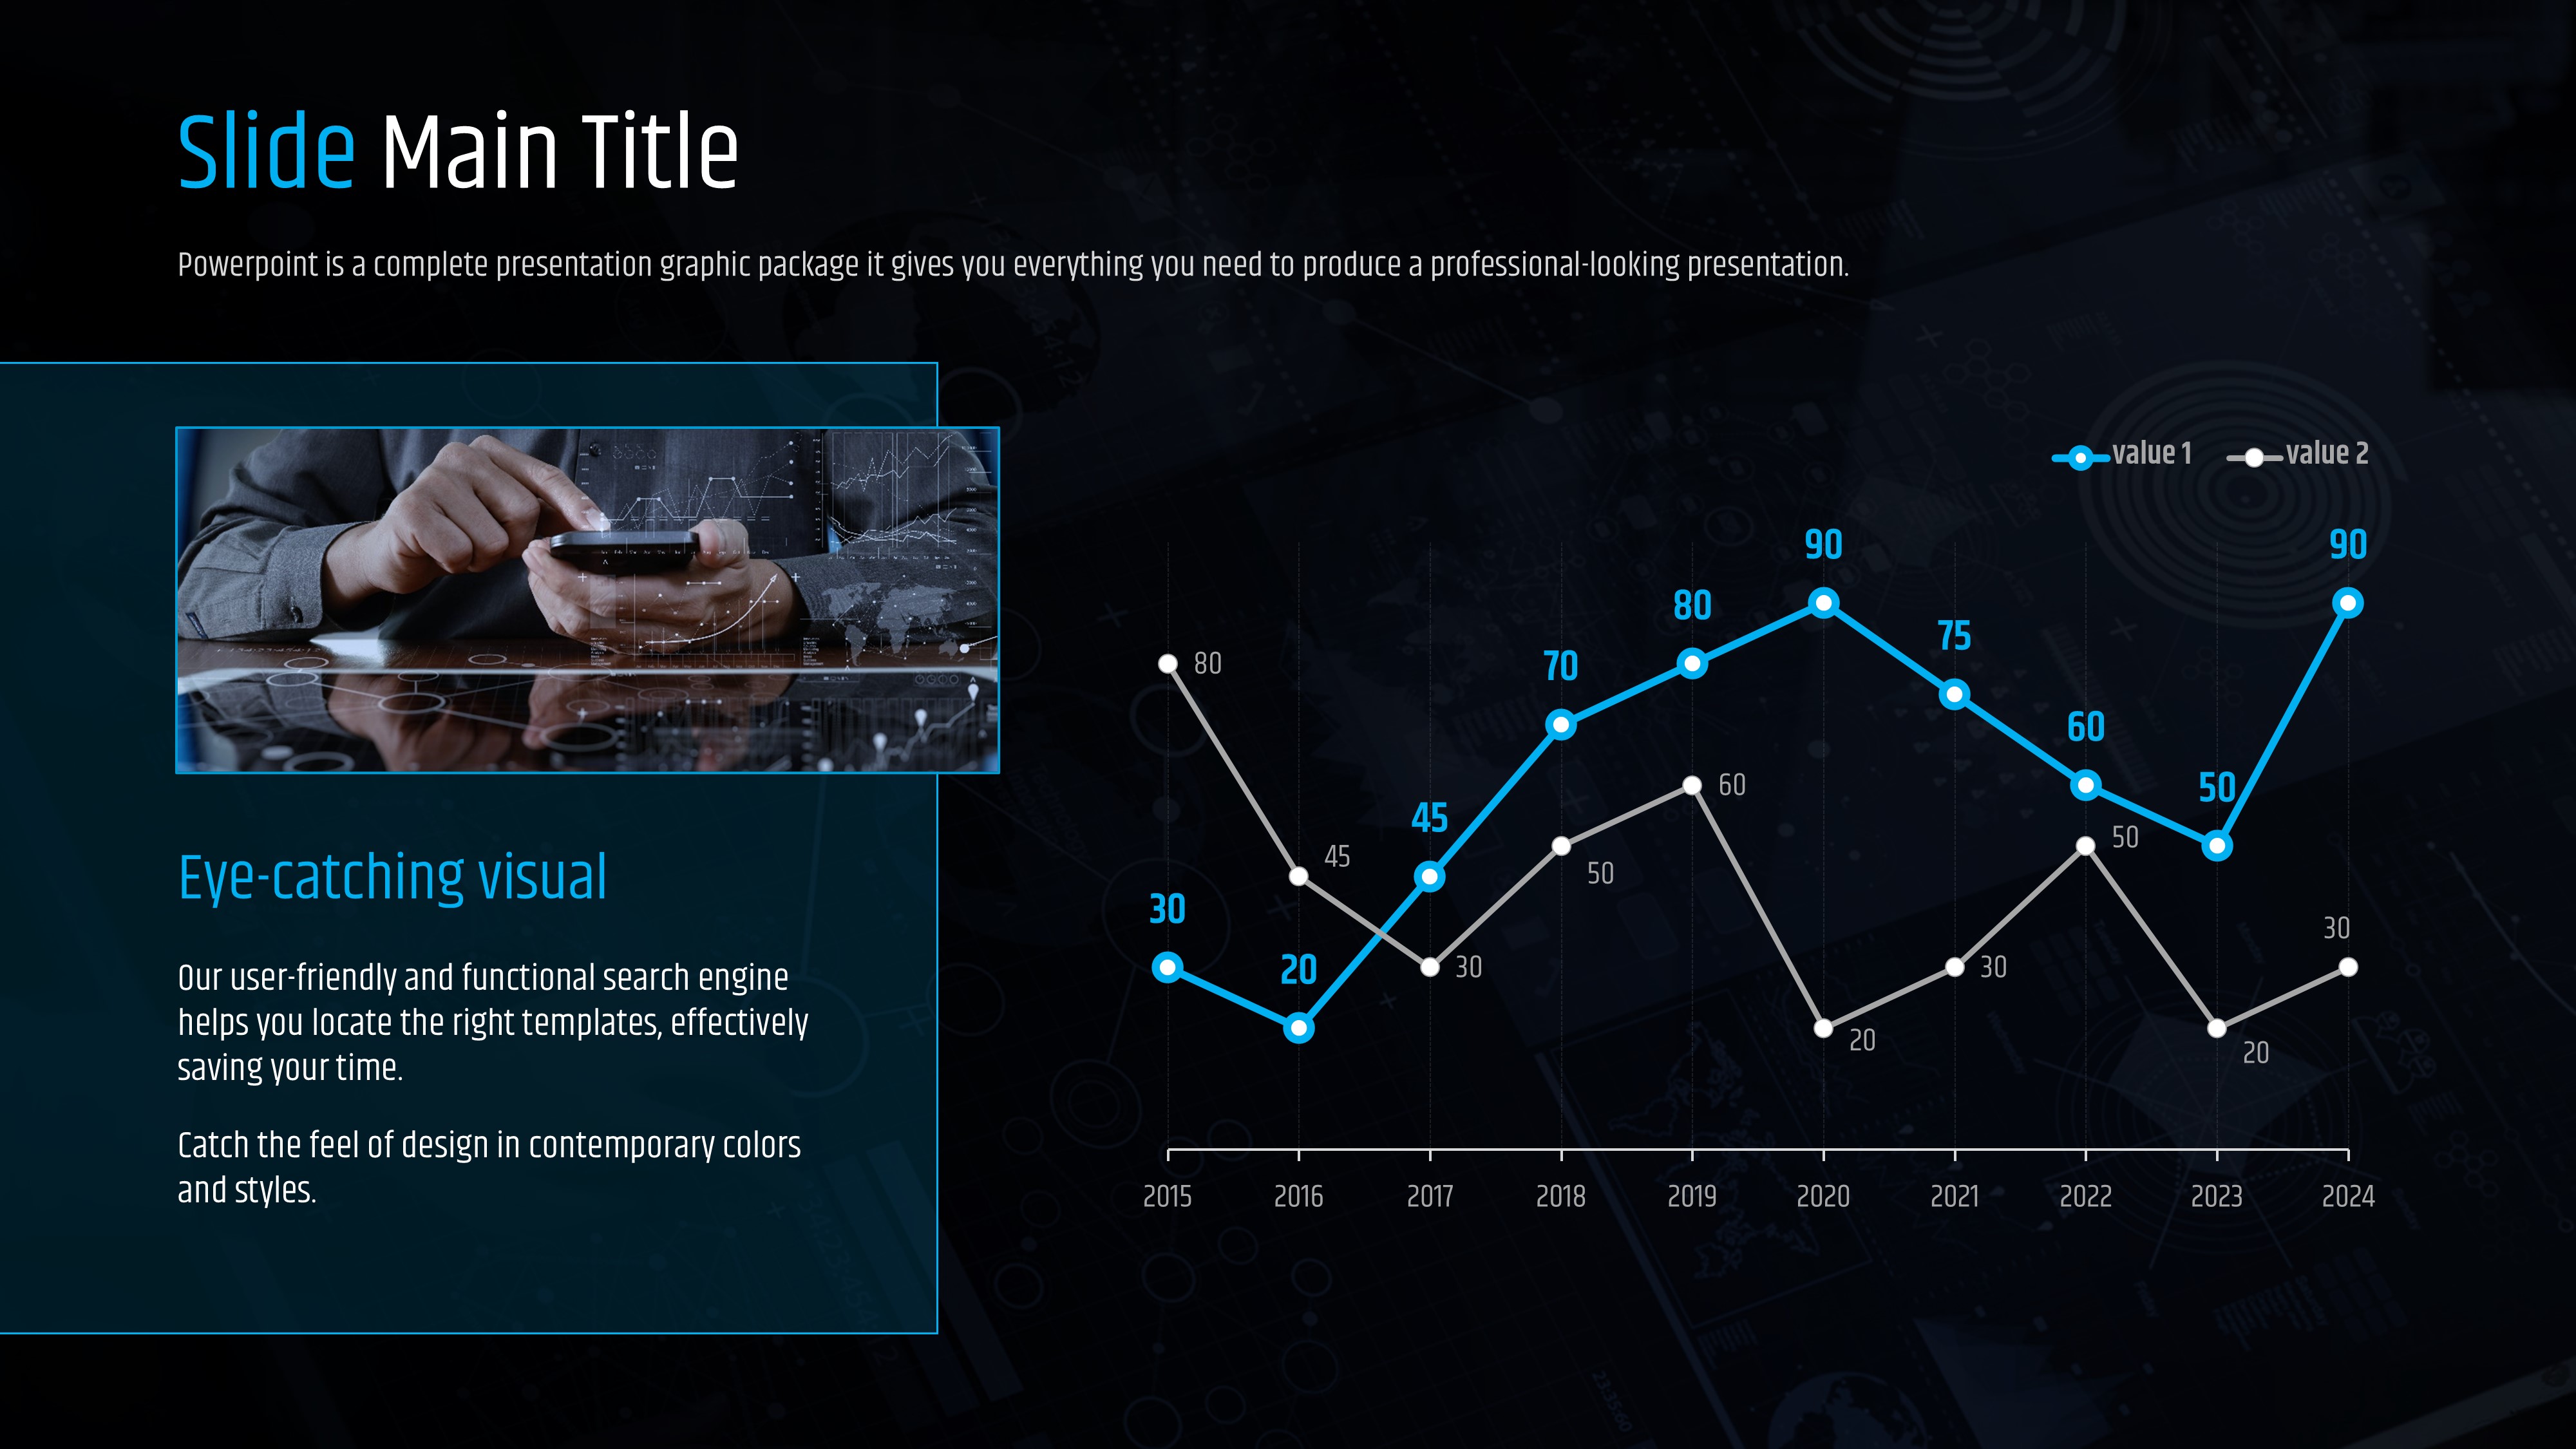
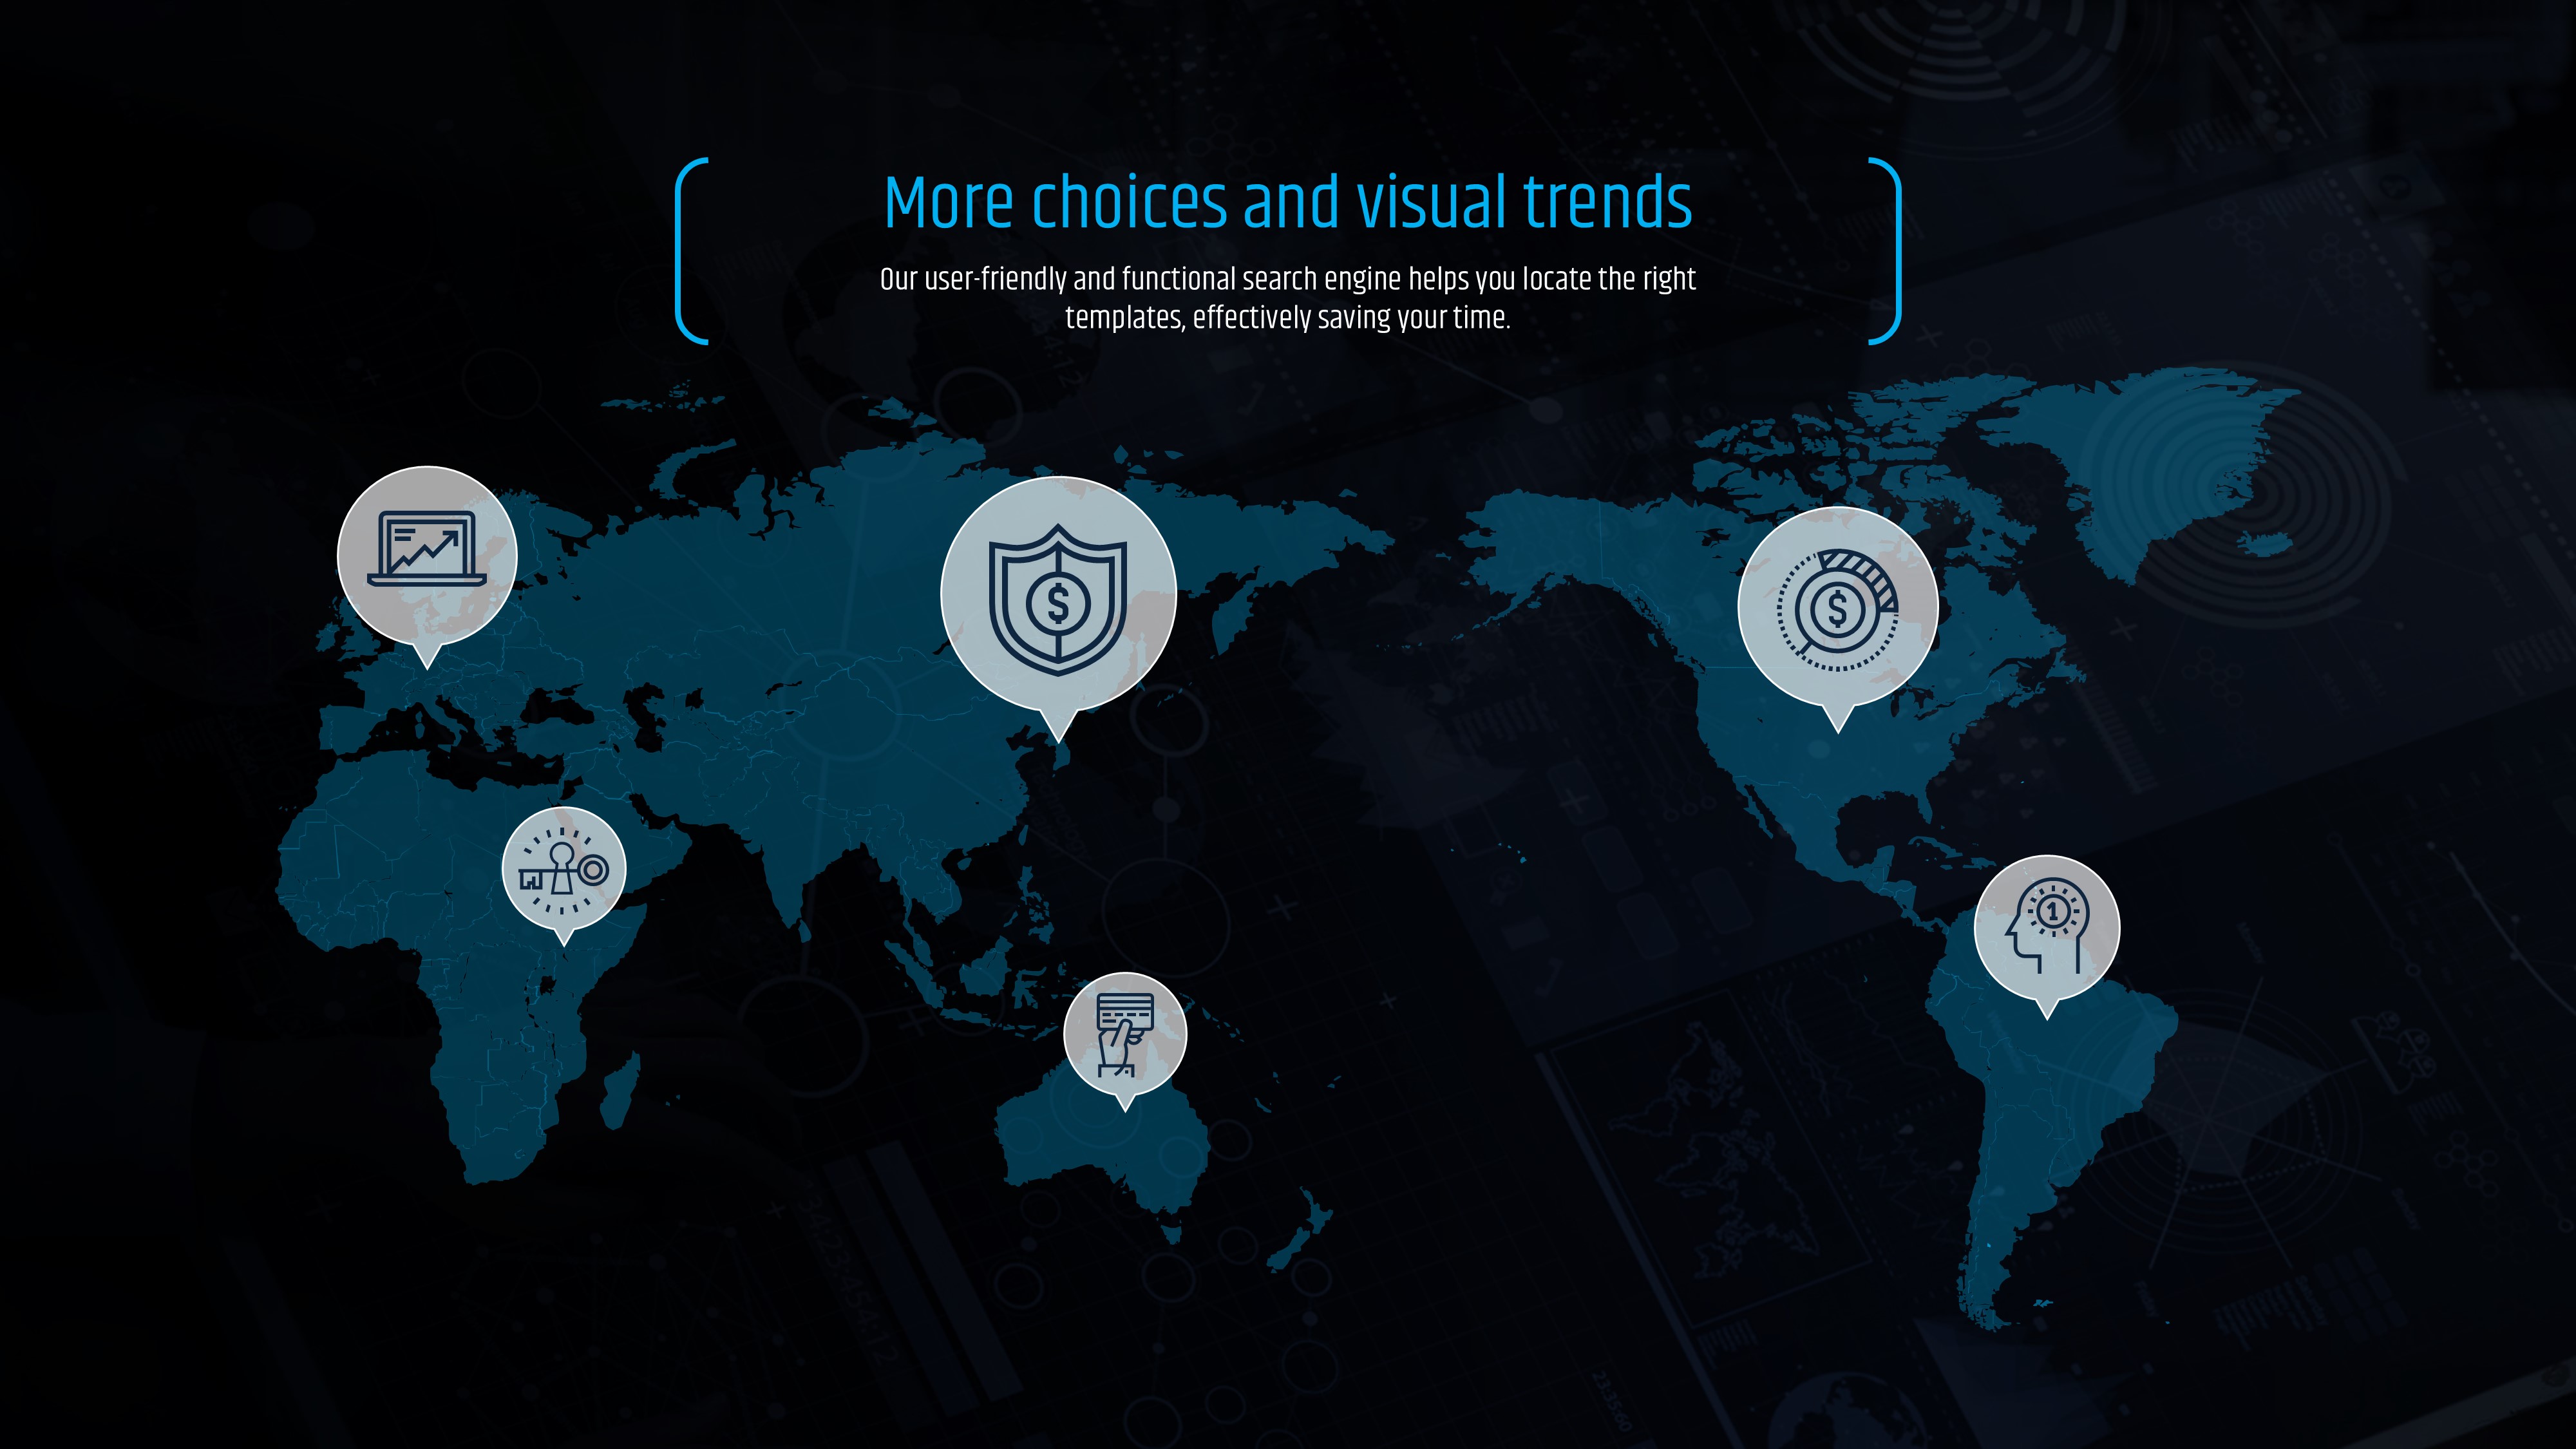
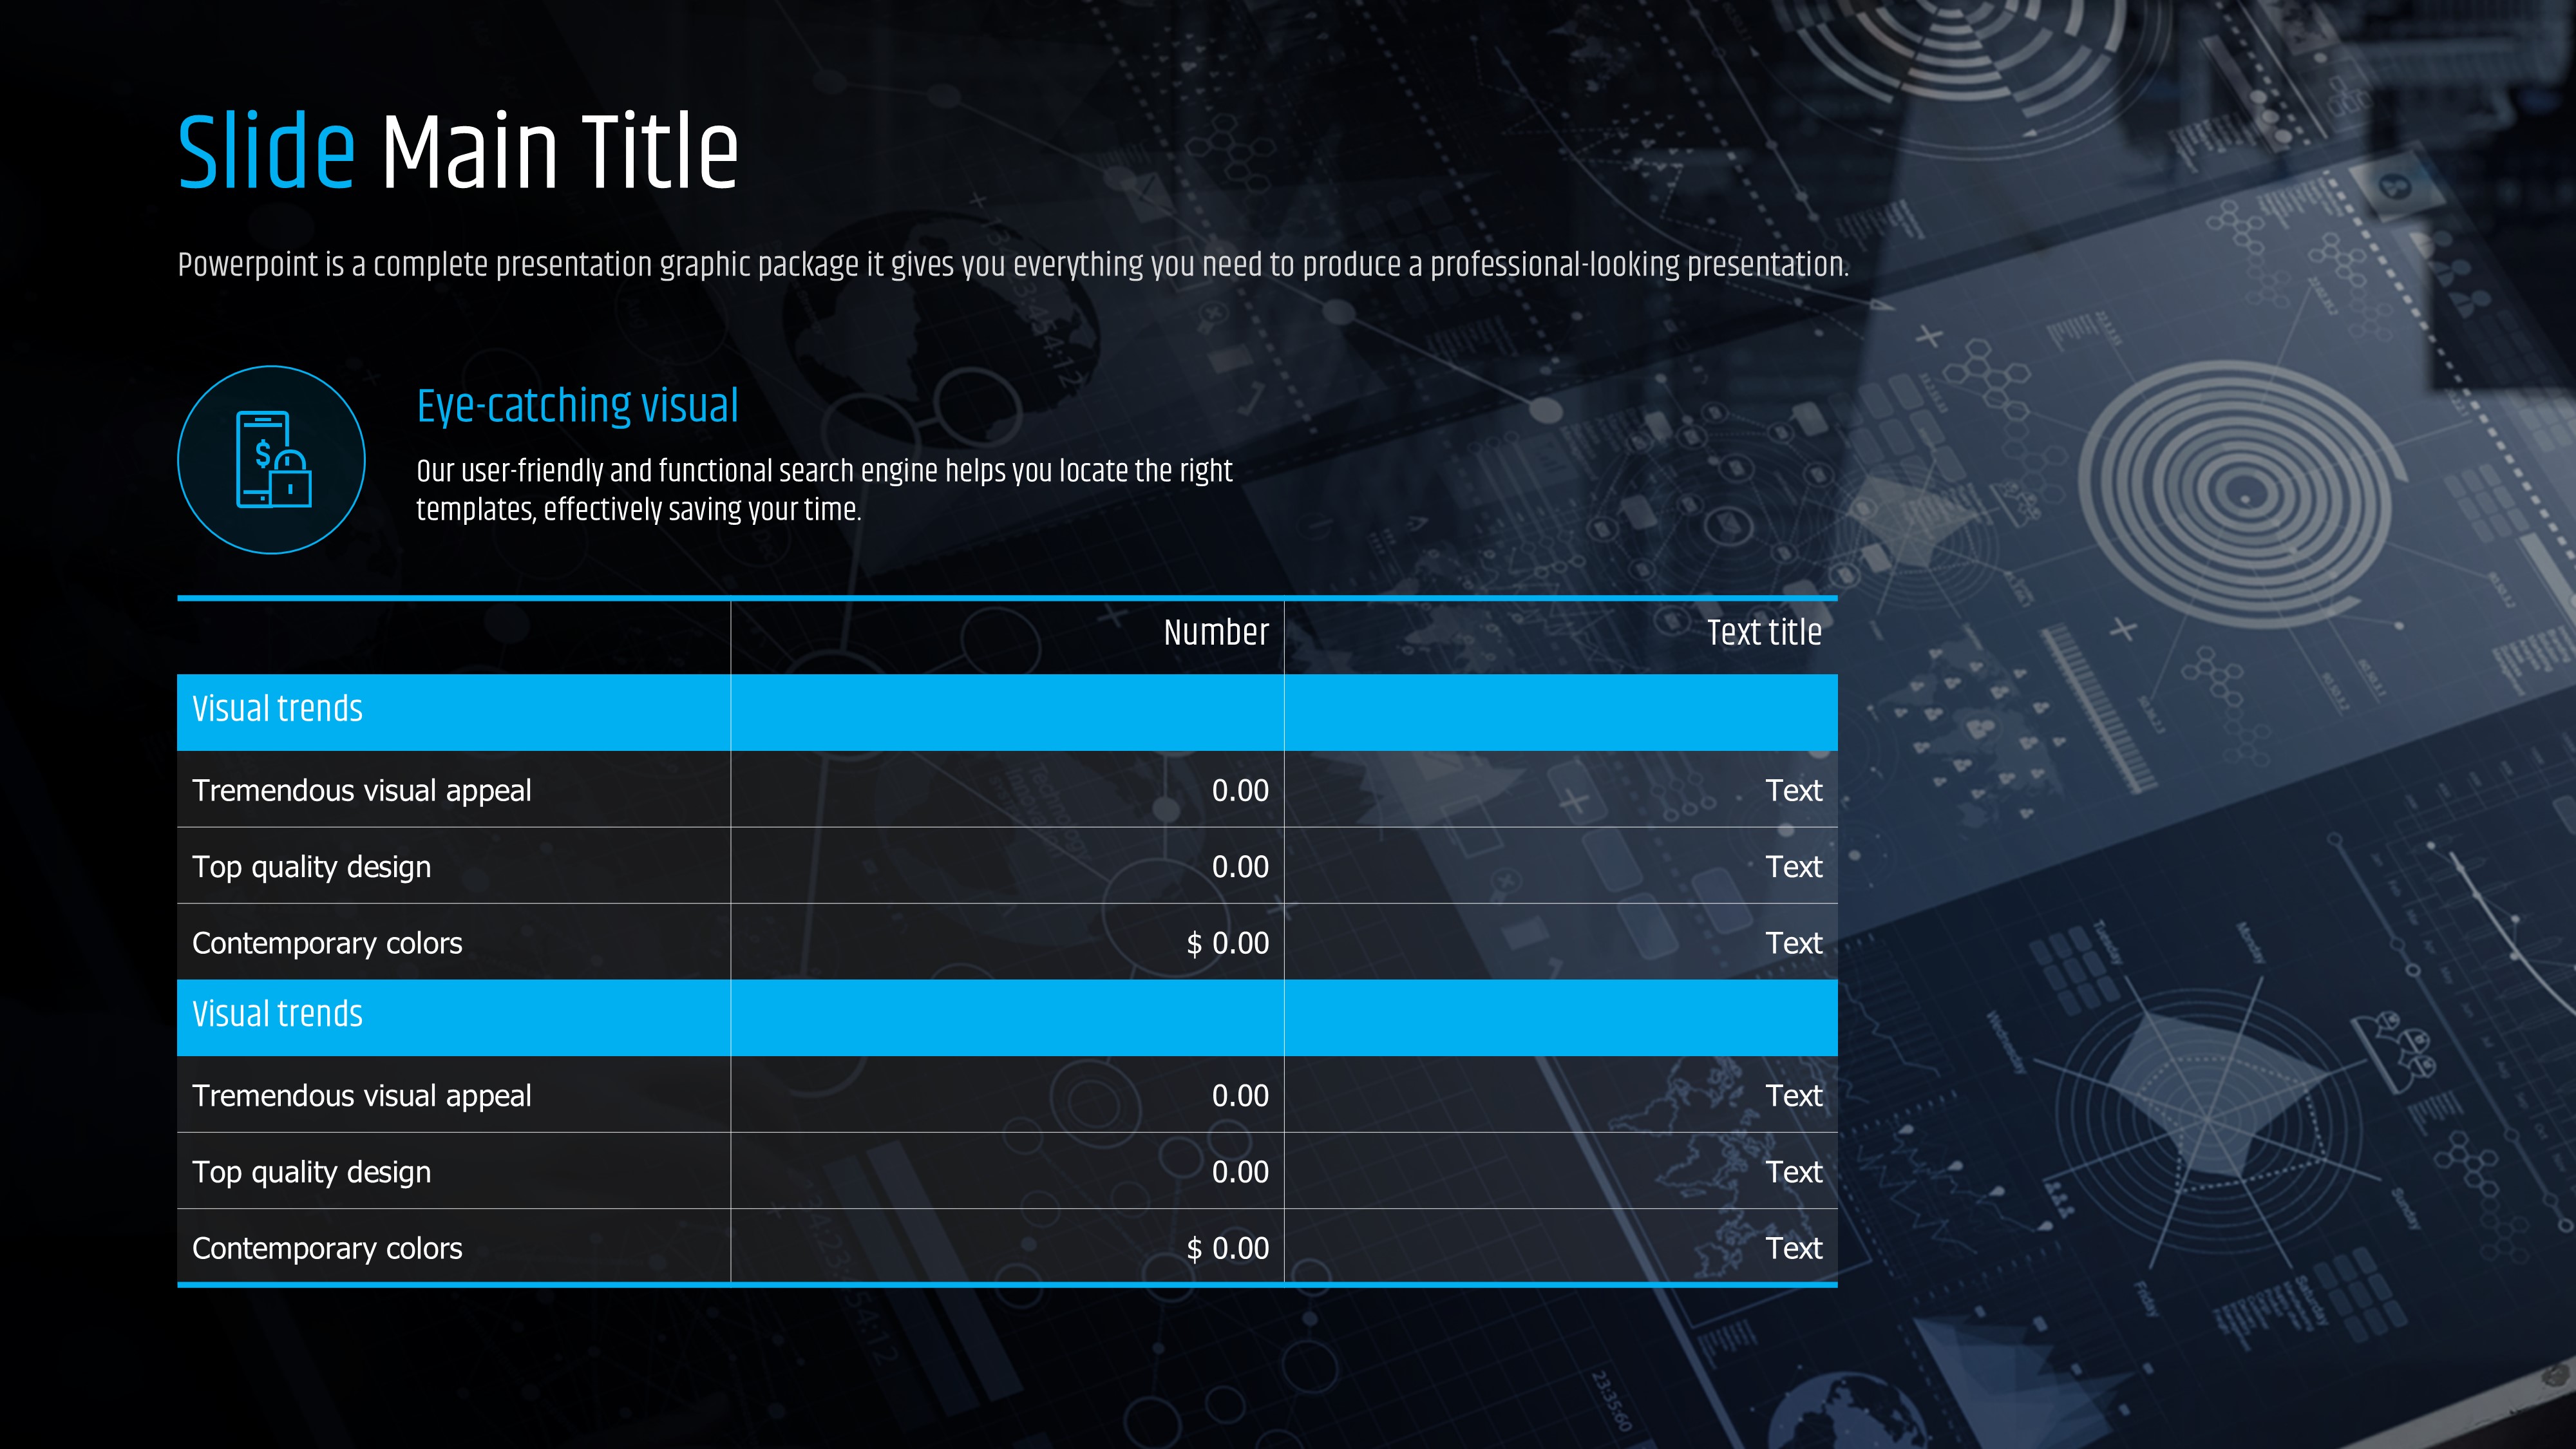
A professional PowerPoint template designed for fintech and mobile finance presentations, featuring a deep dark navy and charcoal black background with cyan-blue accent colors. This 20-slide deck includes bar charts, donut charts, circular radial diagrams, step-by-step process slides, and four-column comparison layouts — all optimized for clear financial data visualization. The high-contrast dark theme enhances data readability, while line-style icons and circular graphic elements reinforce a tech-forward, trustworthy presentation atmosphere. Ideal for investor meetings, mobile banking platform introductions, and fintech service pitches, this presentation template is fully editable in PPTX format. Customize text, chart values, and accent colors to match your brand identity. Designed in 16:9 ratio for seamless display on large screens and projectors. Whether you're pitching to investors or presenting quarterly financial data, this slide deck delivers your message with clarity and impact.
Usage Points
-
Main Usage
Designed for fintech startups, mobile banking platforms, and financial service teams to present data-driven insights, product features, and investment pitches with a professional, tech-forward visual identity.
-
How to Use
Open the PPTX file and replace placeholder text, chart values, and icons with your actual content. The dark navy background and cyan-blue accent colors can be adjusted to align with your brand guidelines using PowerPoint's theme color settings.
-
Recommended For
Best suited for fintech founders, IT finance product managers, mobile banking strategists, and financial analysts who need to present complex data clearly to investors, partners, or executive stakeholders.
-
Slide Structure
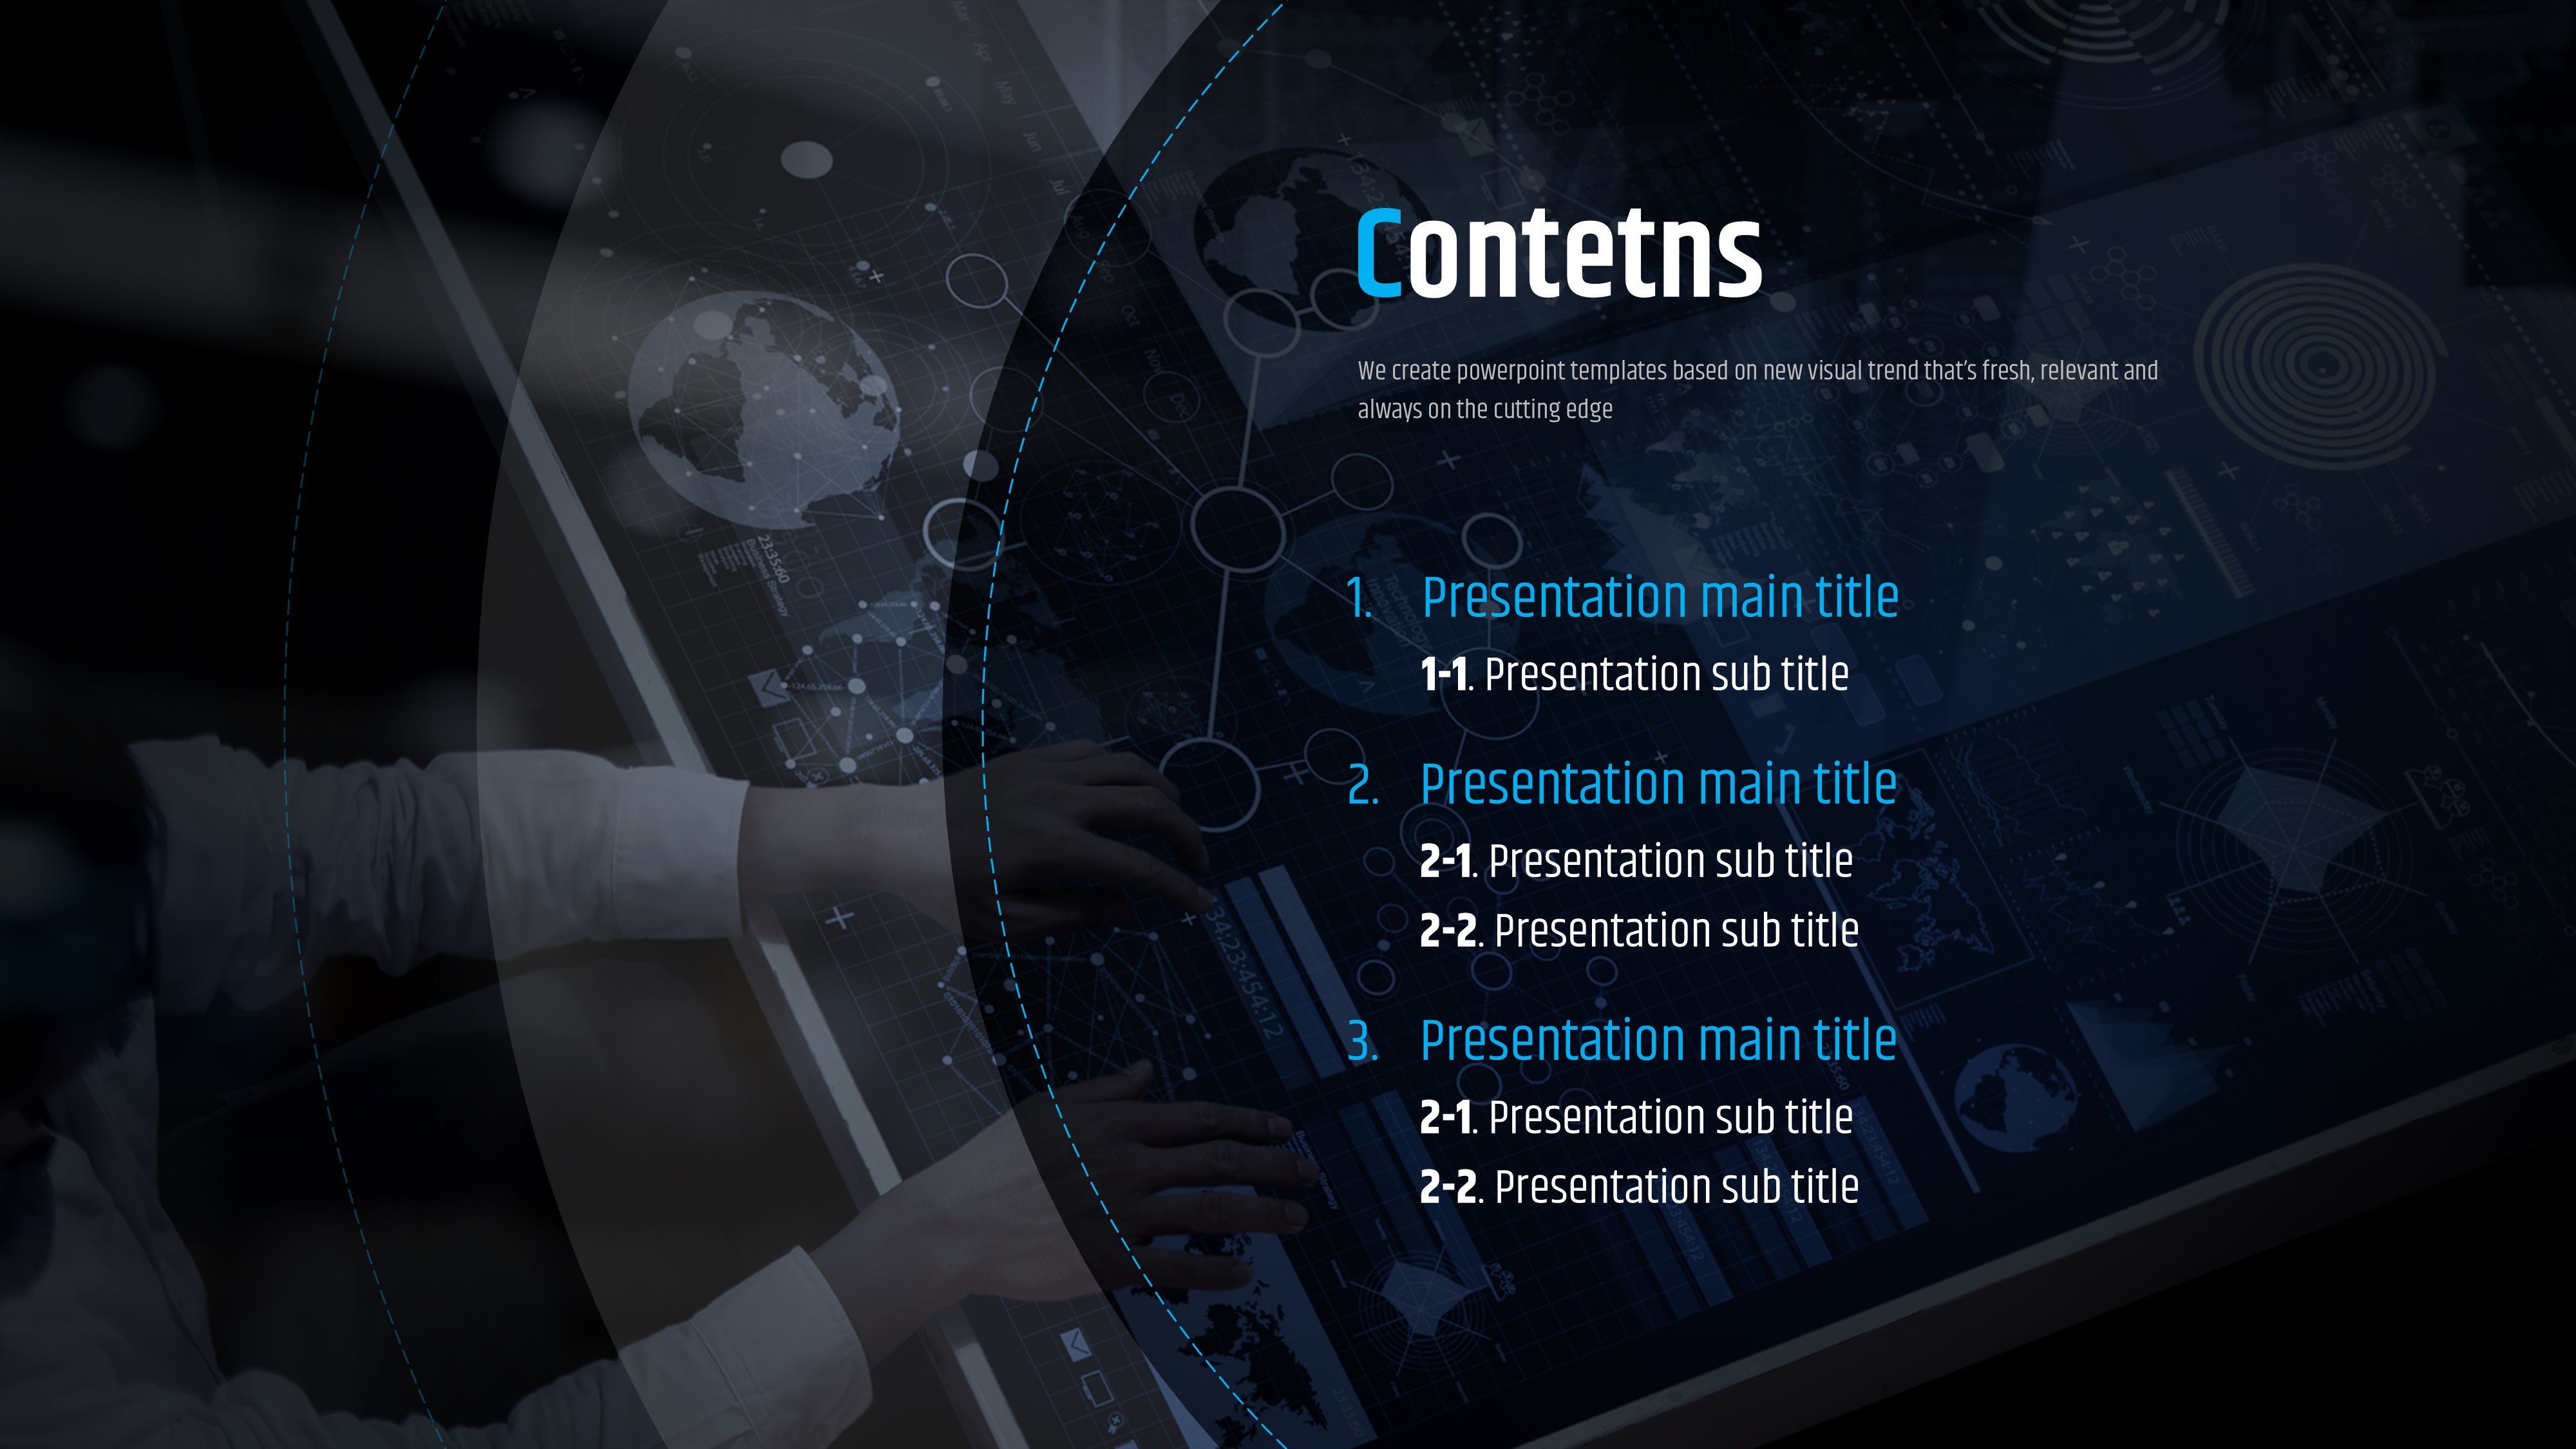
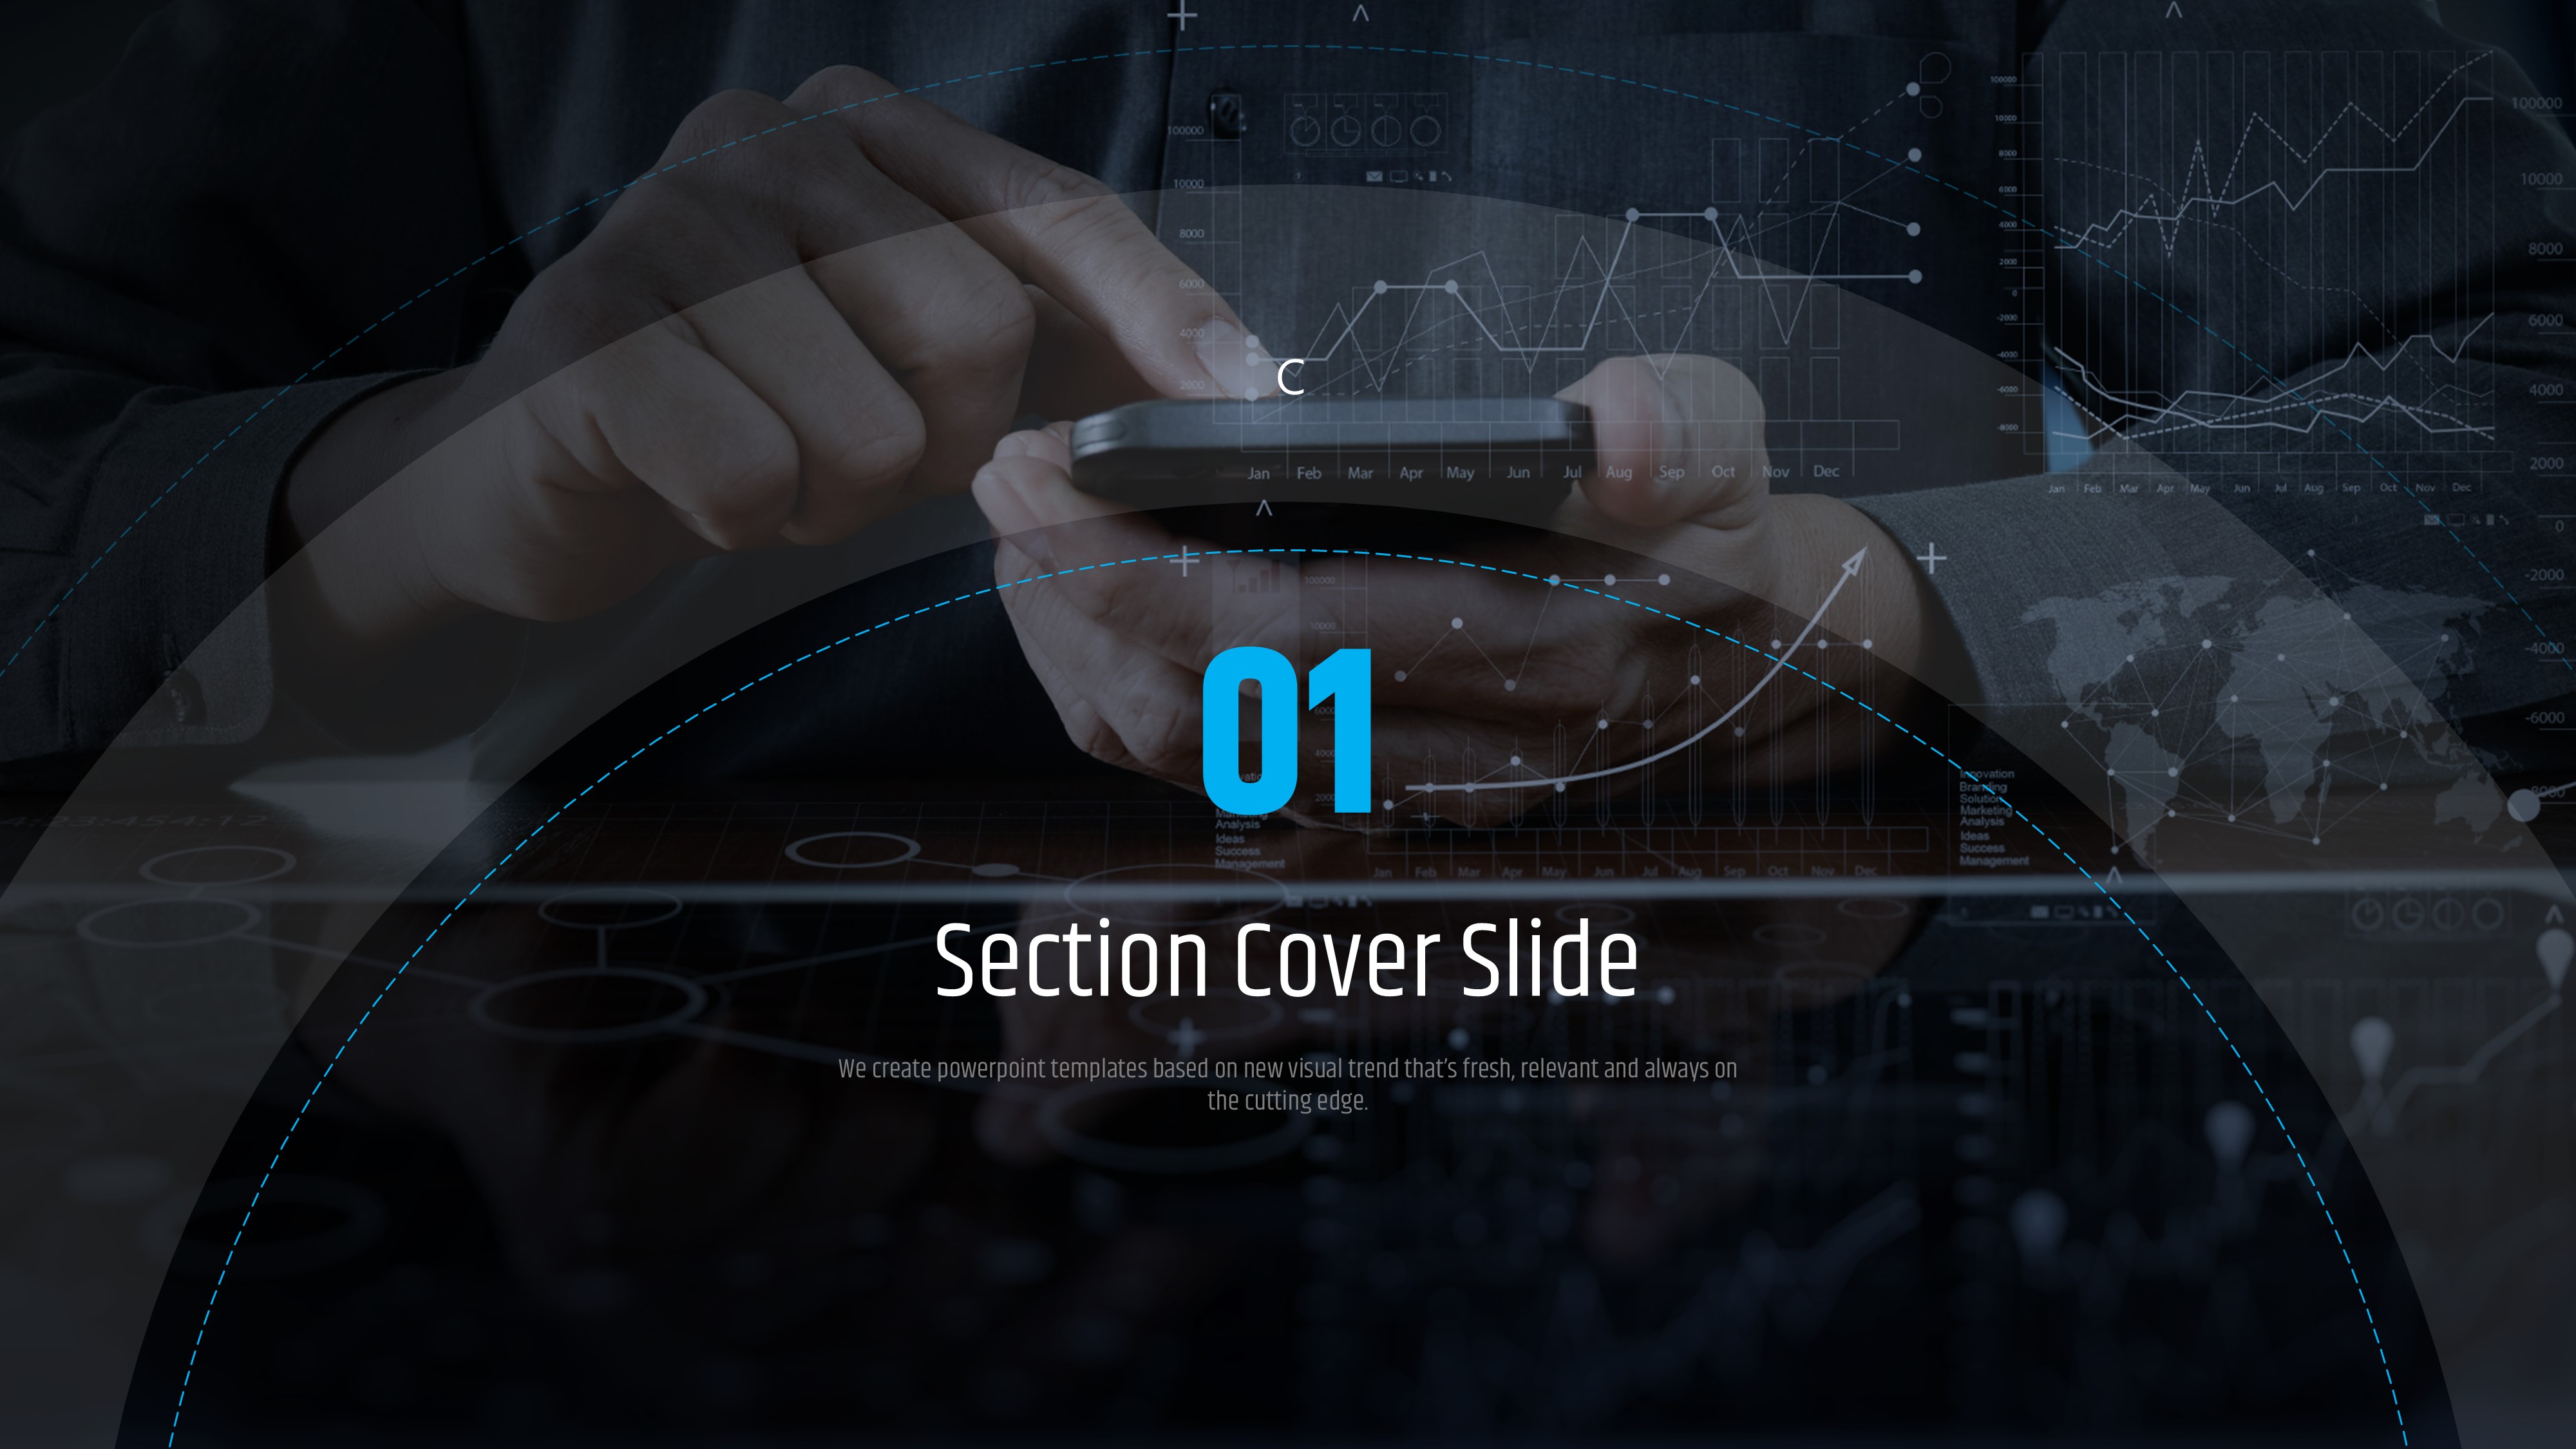
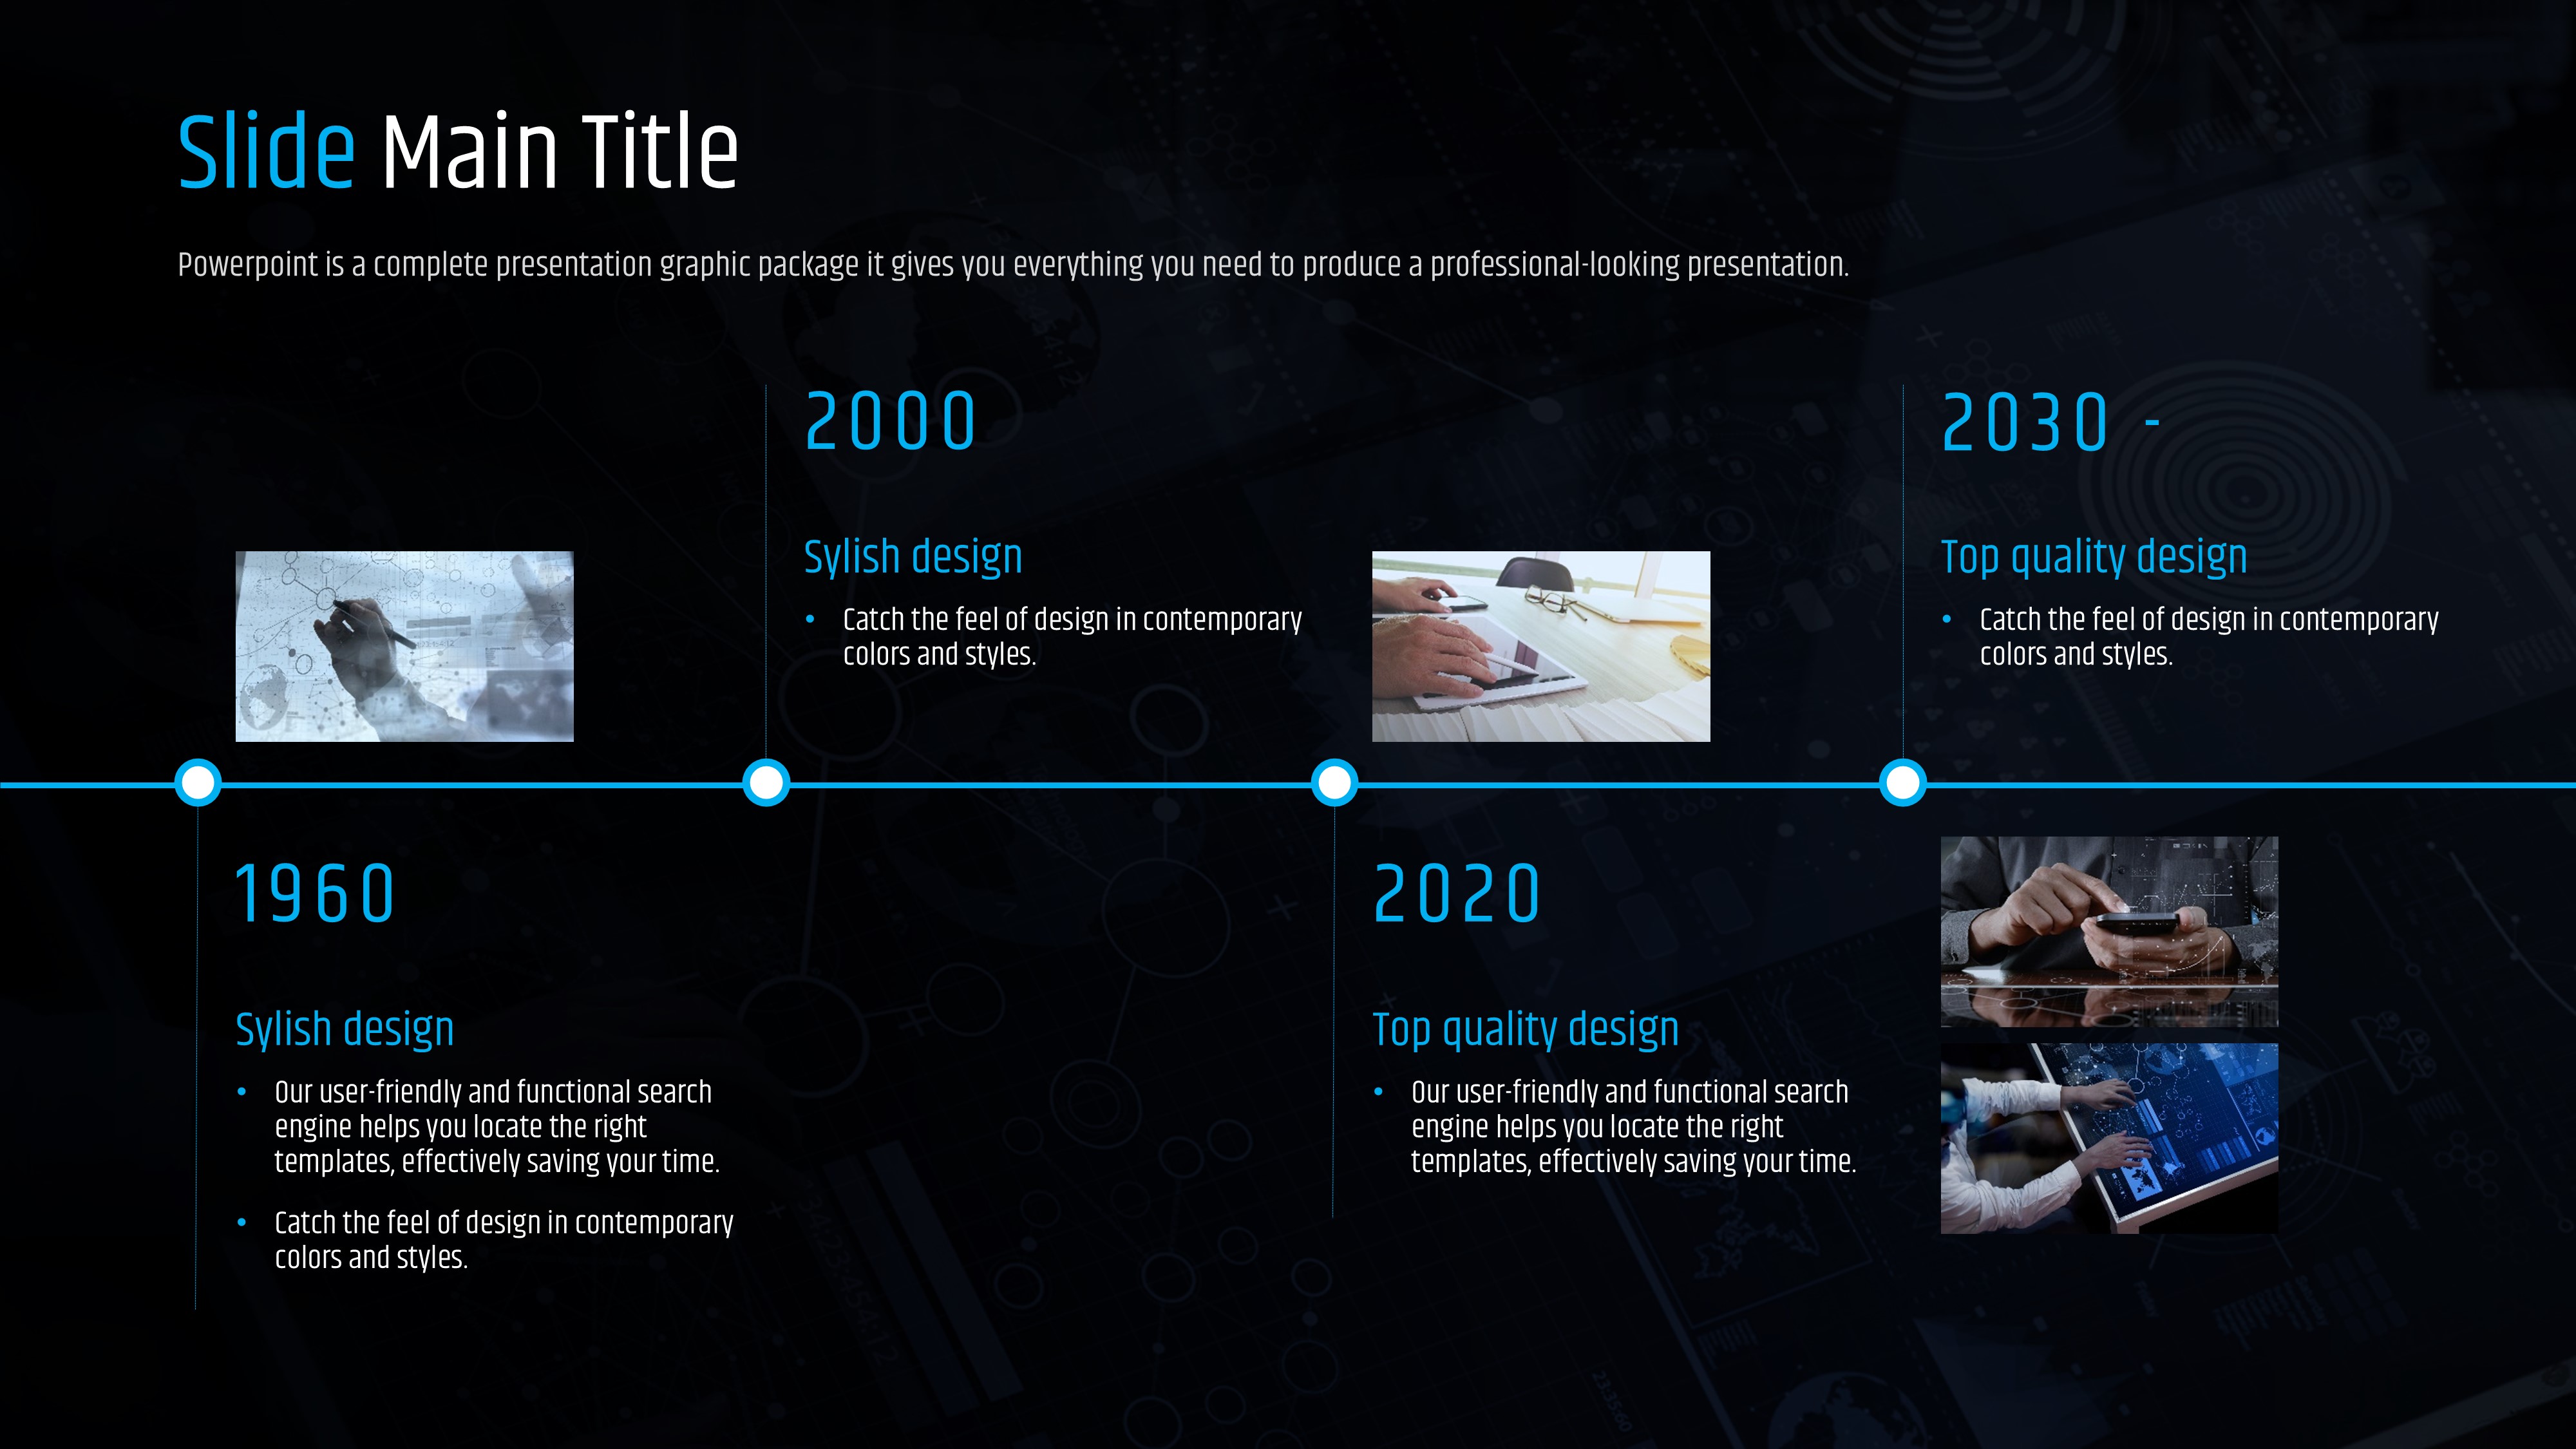
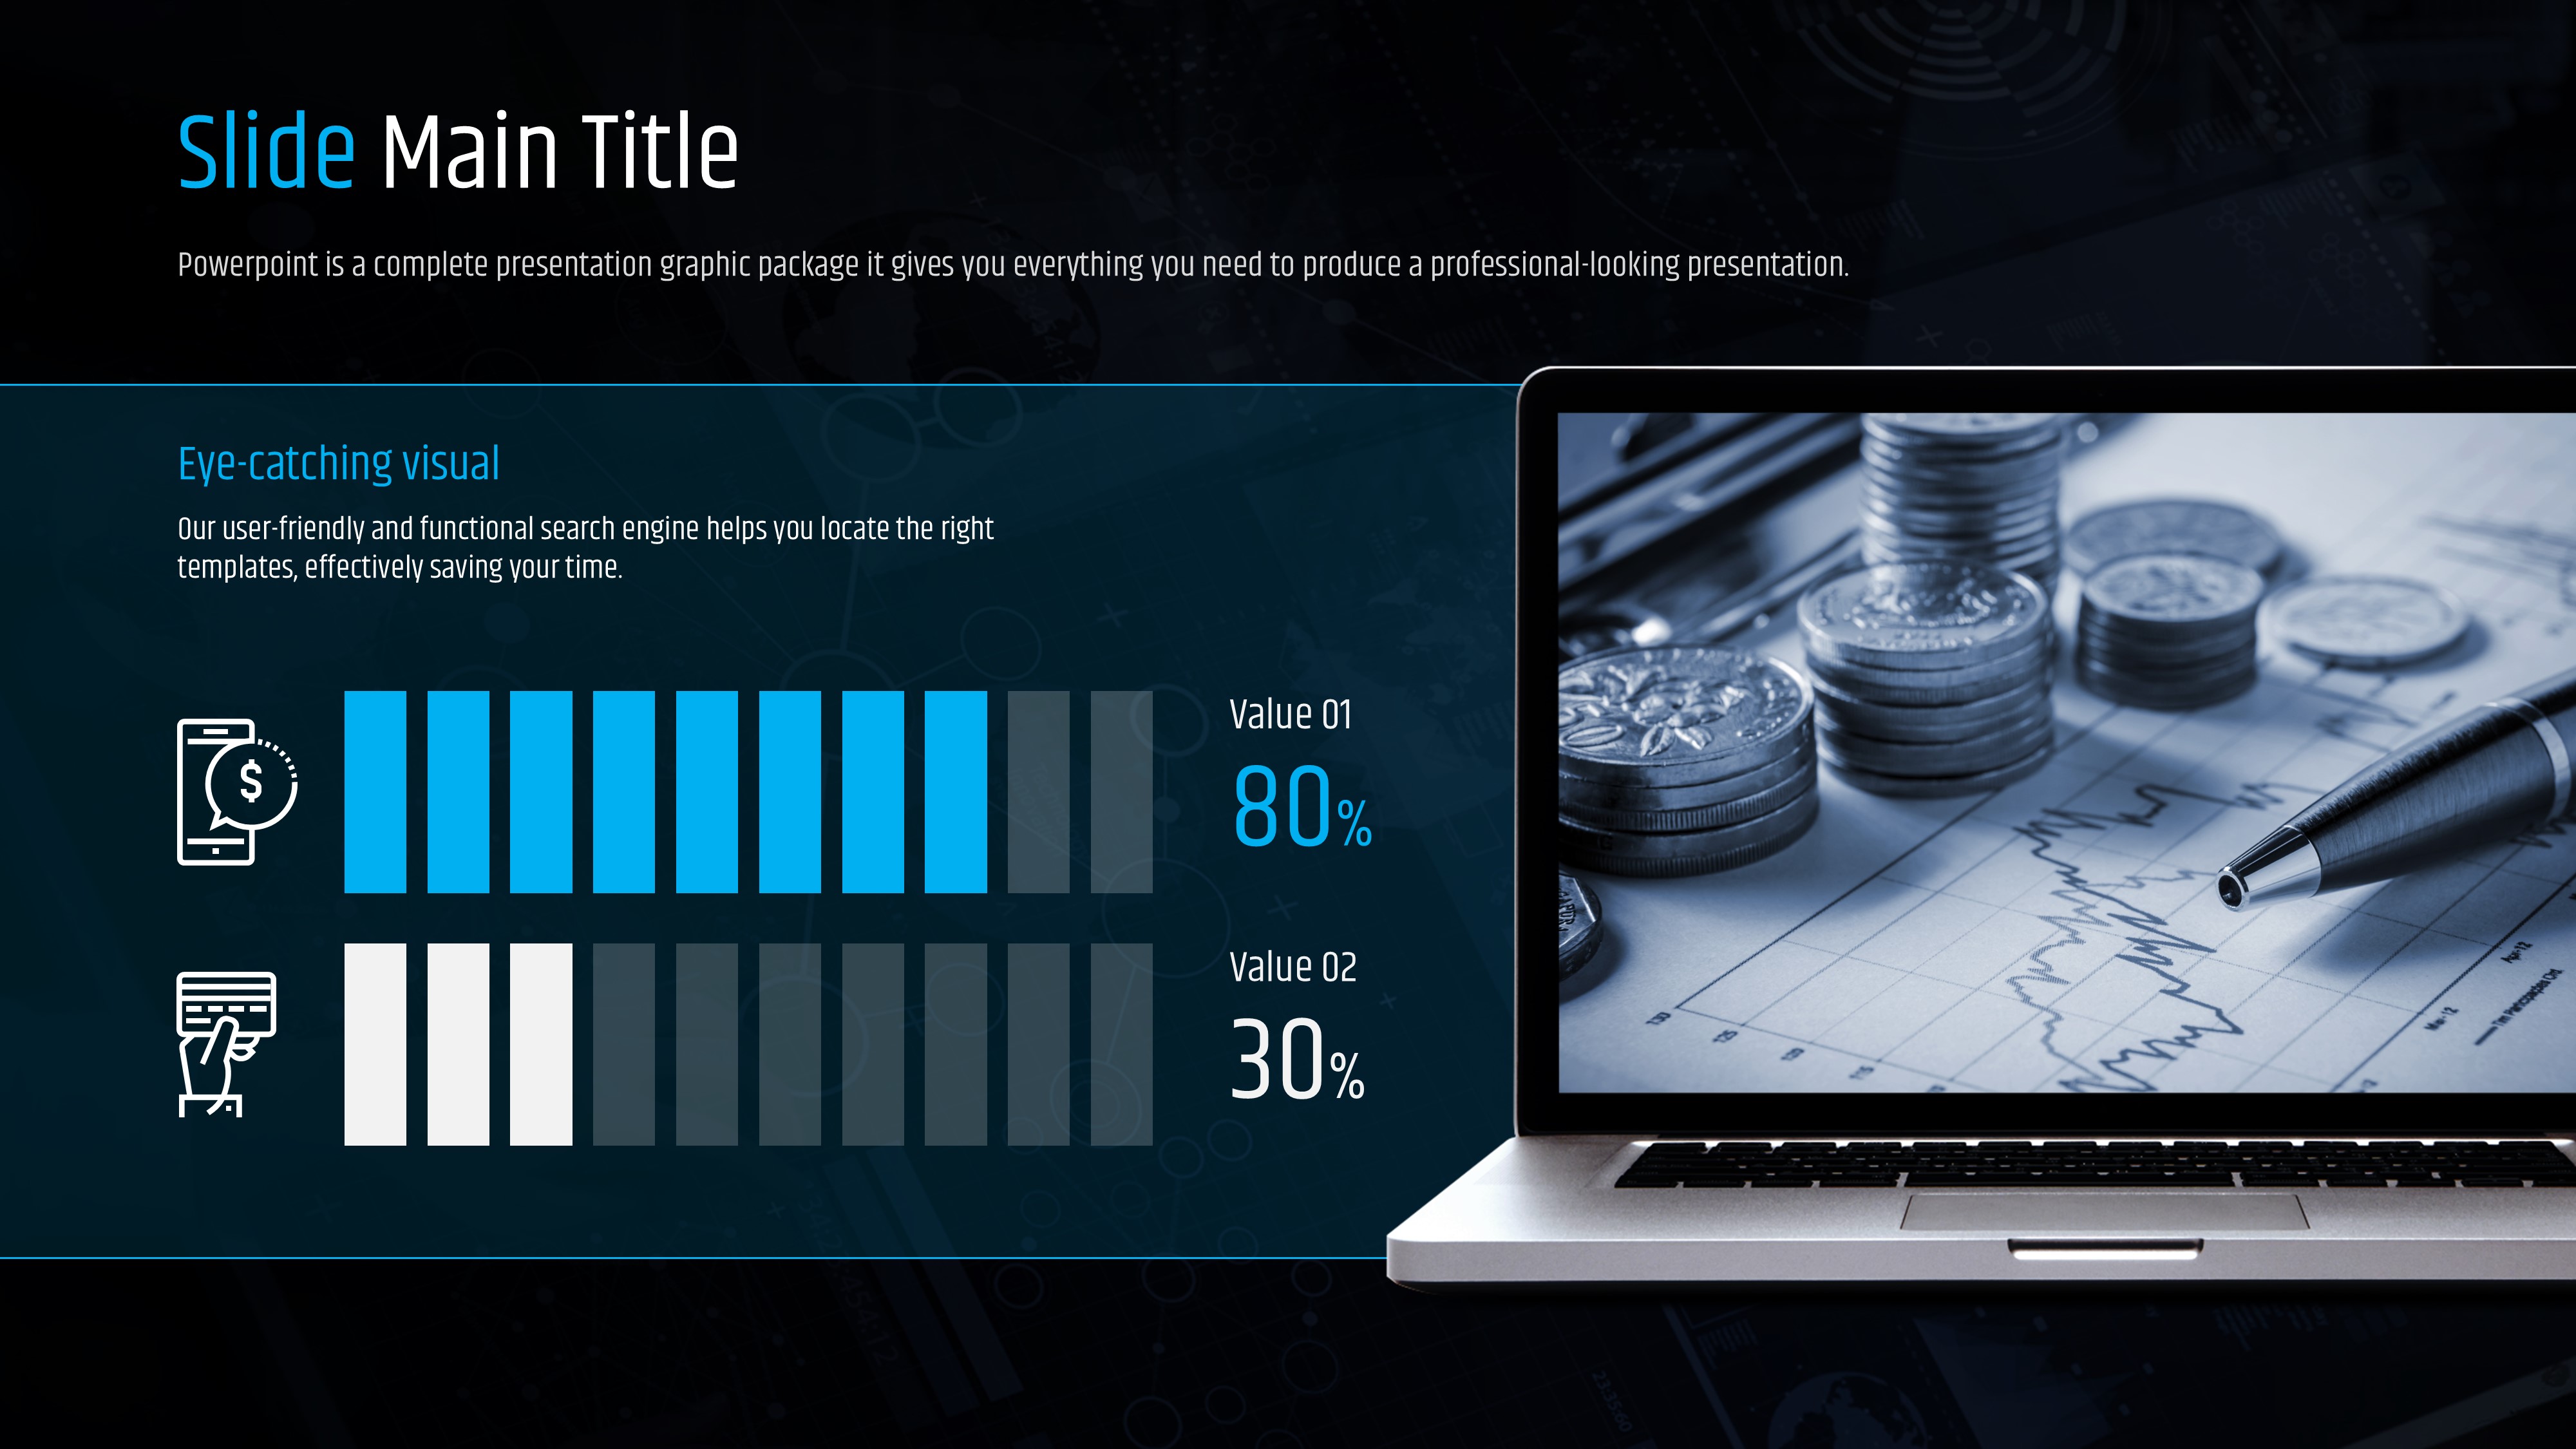
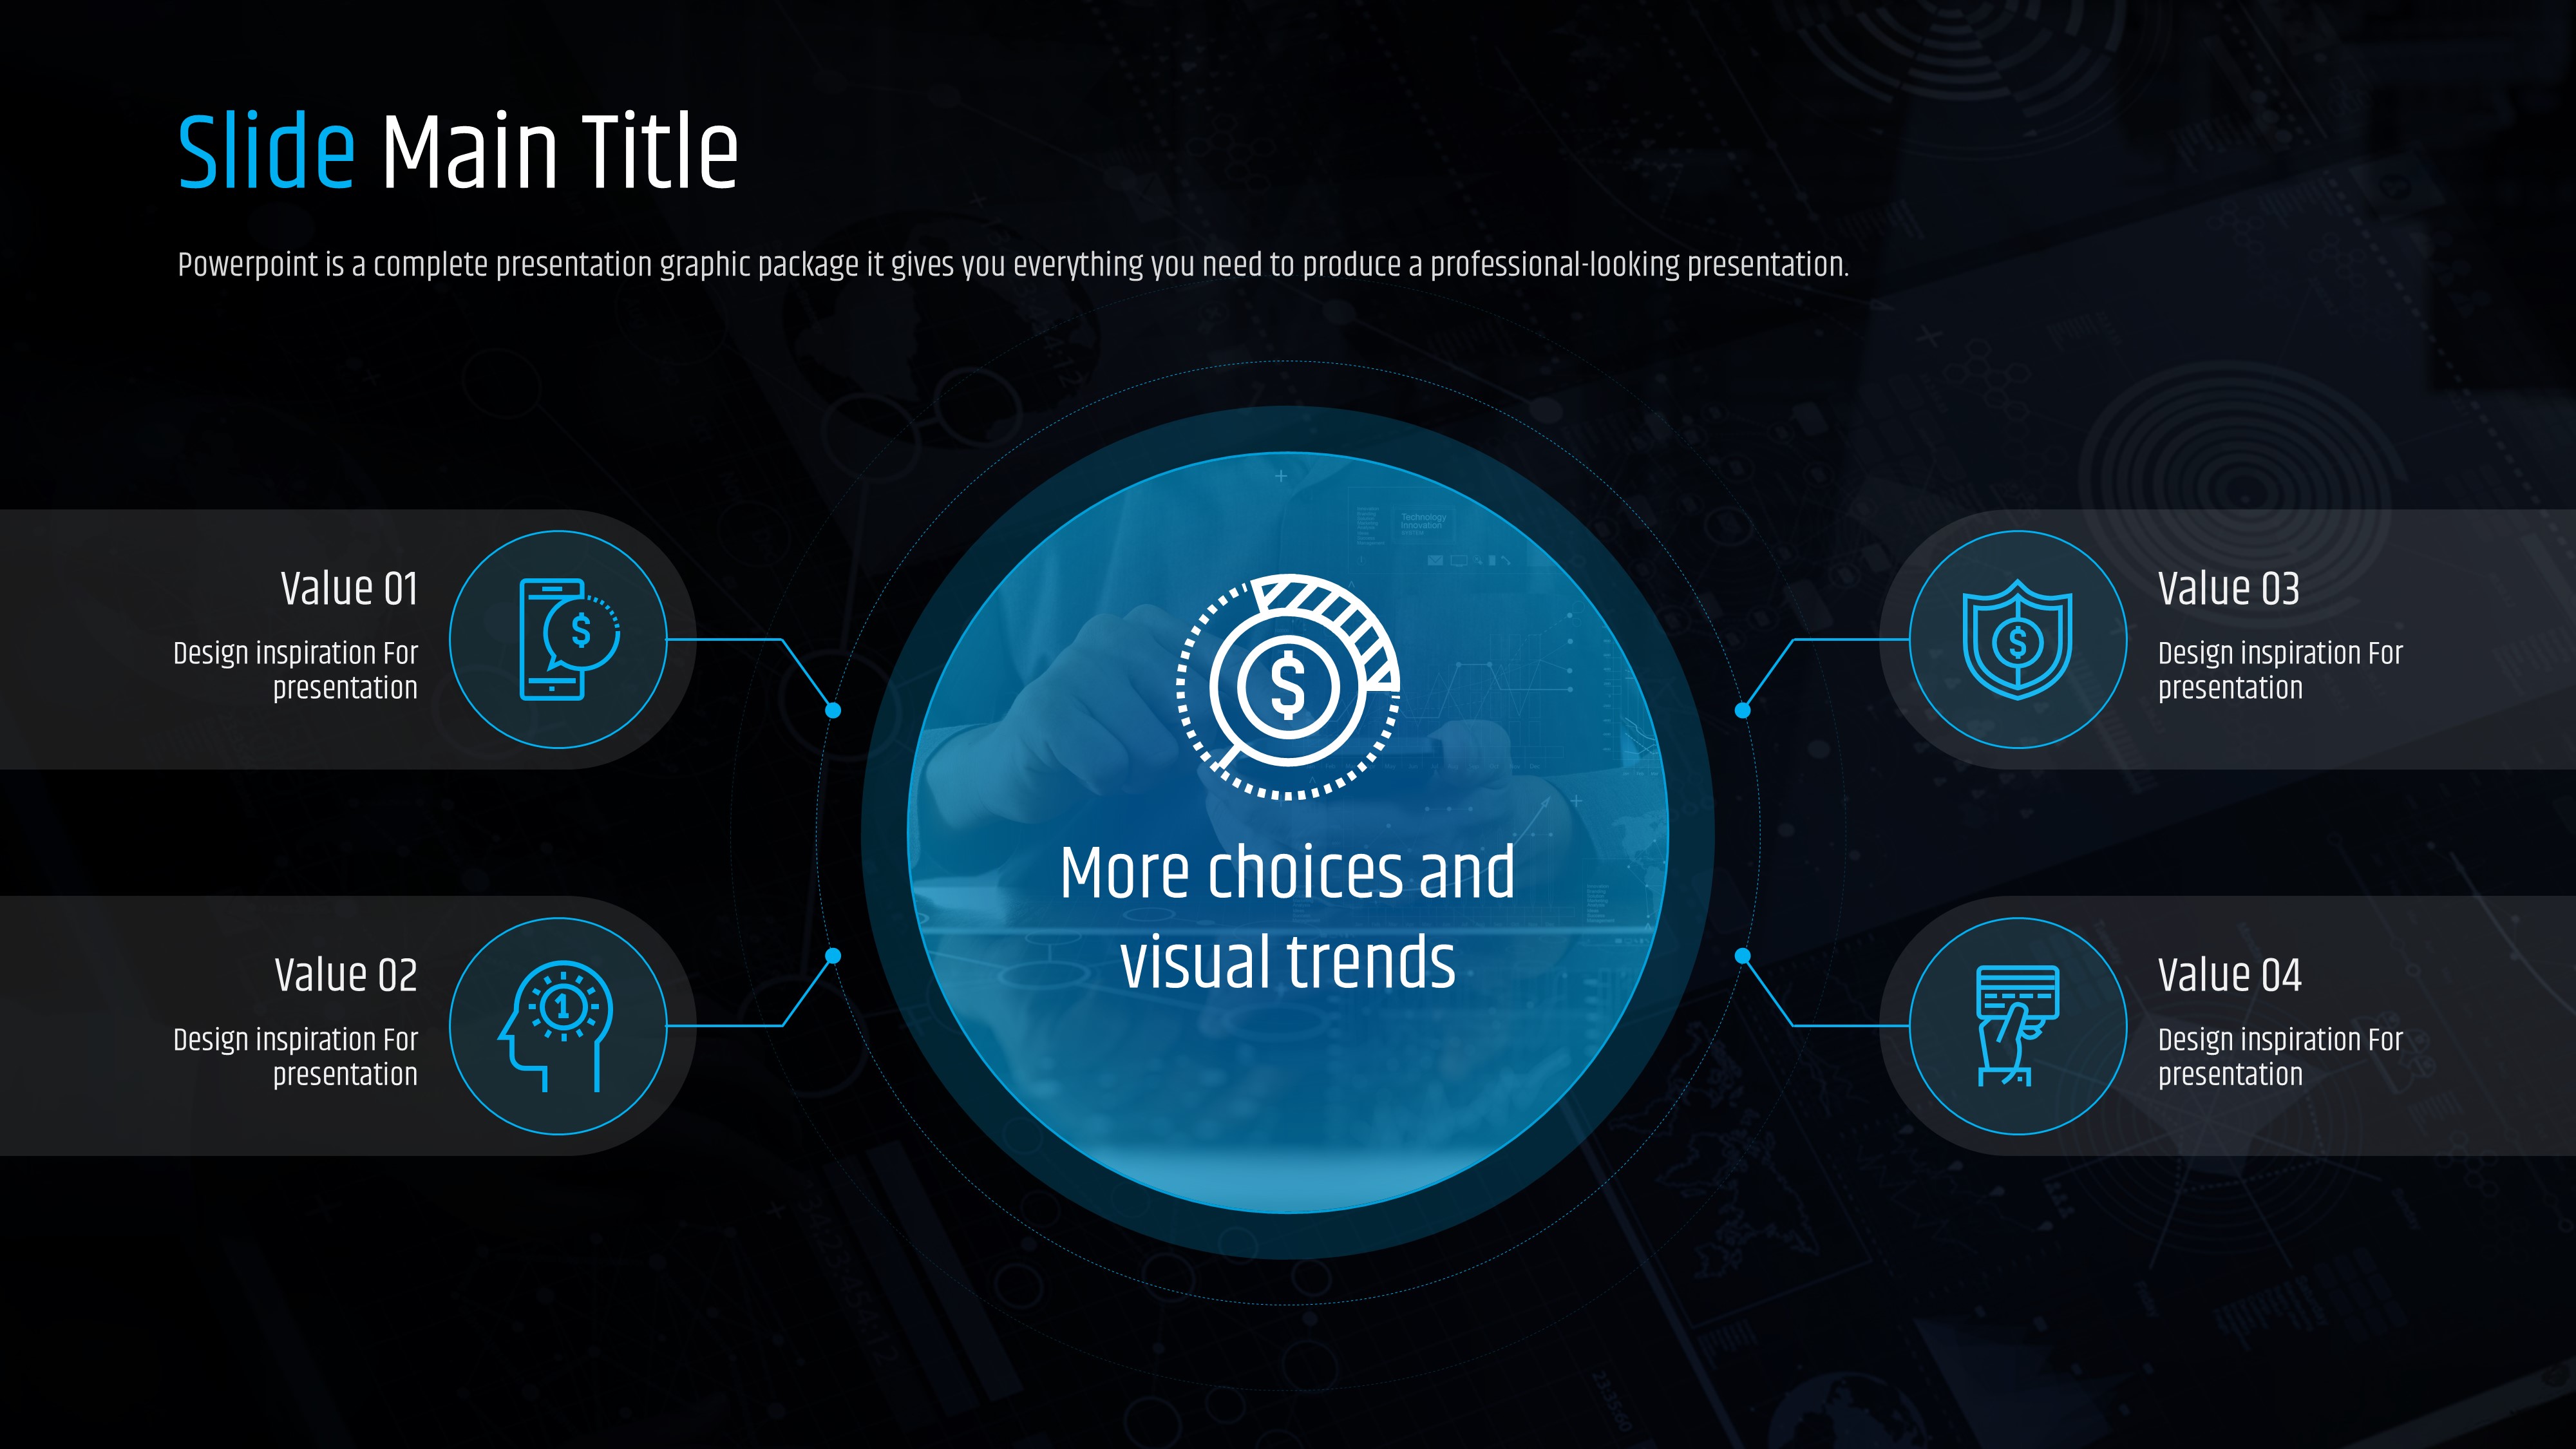
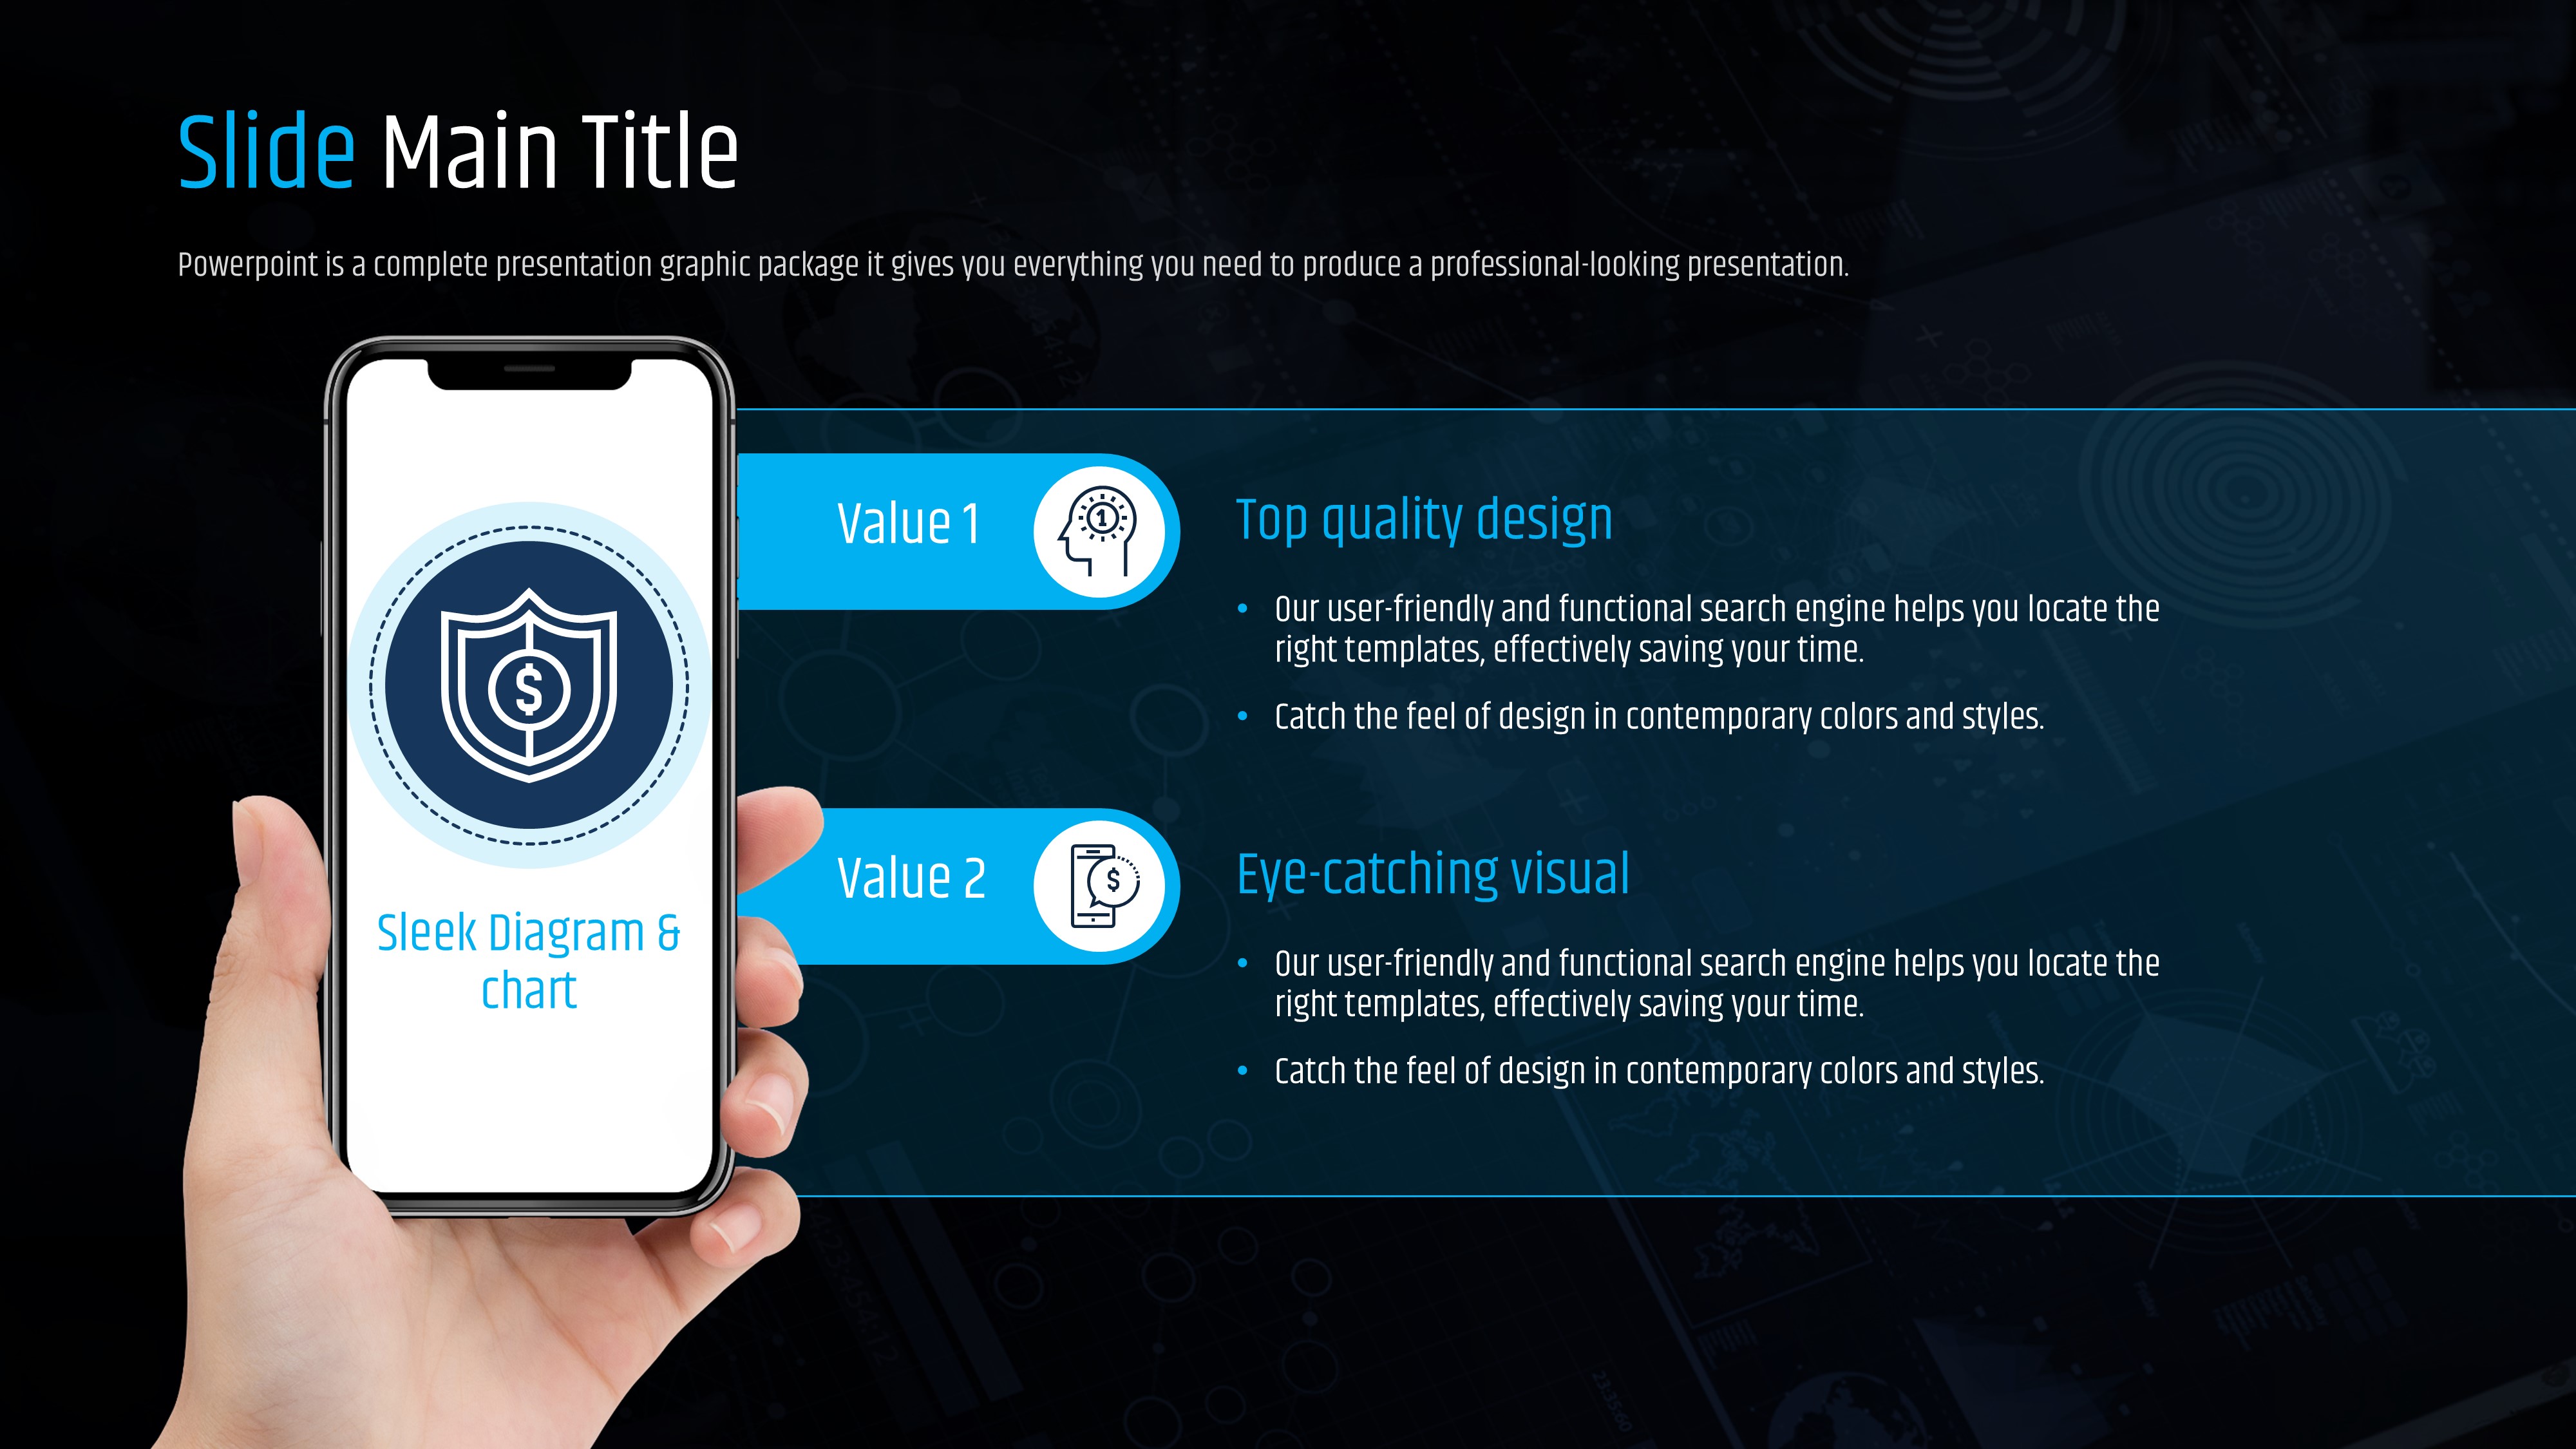
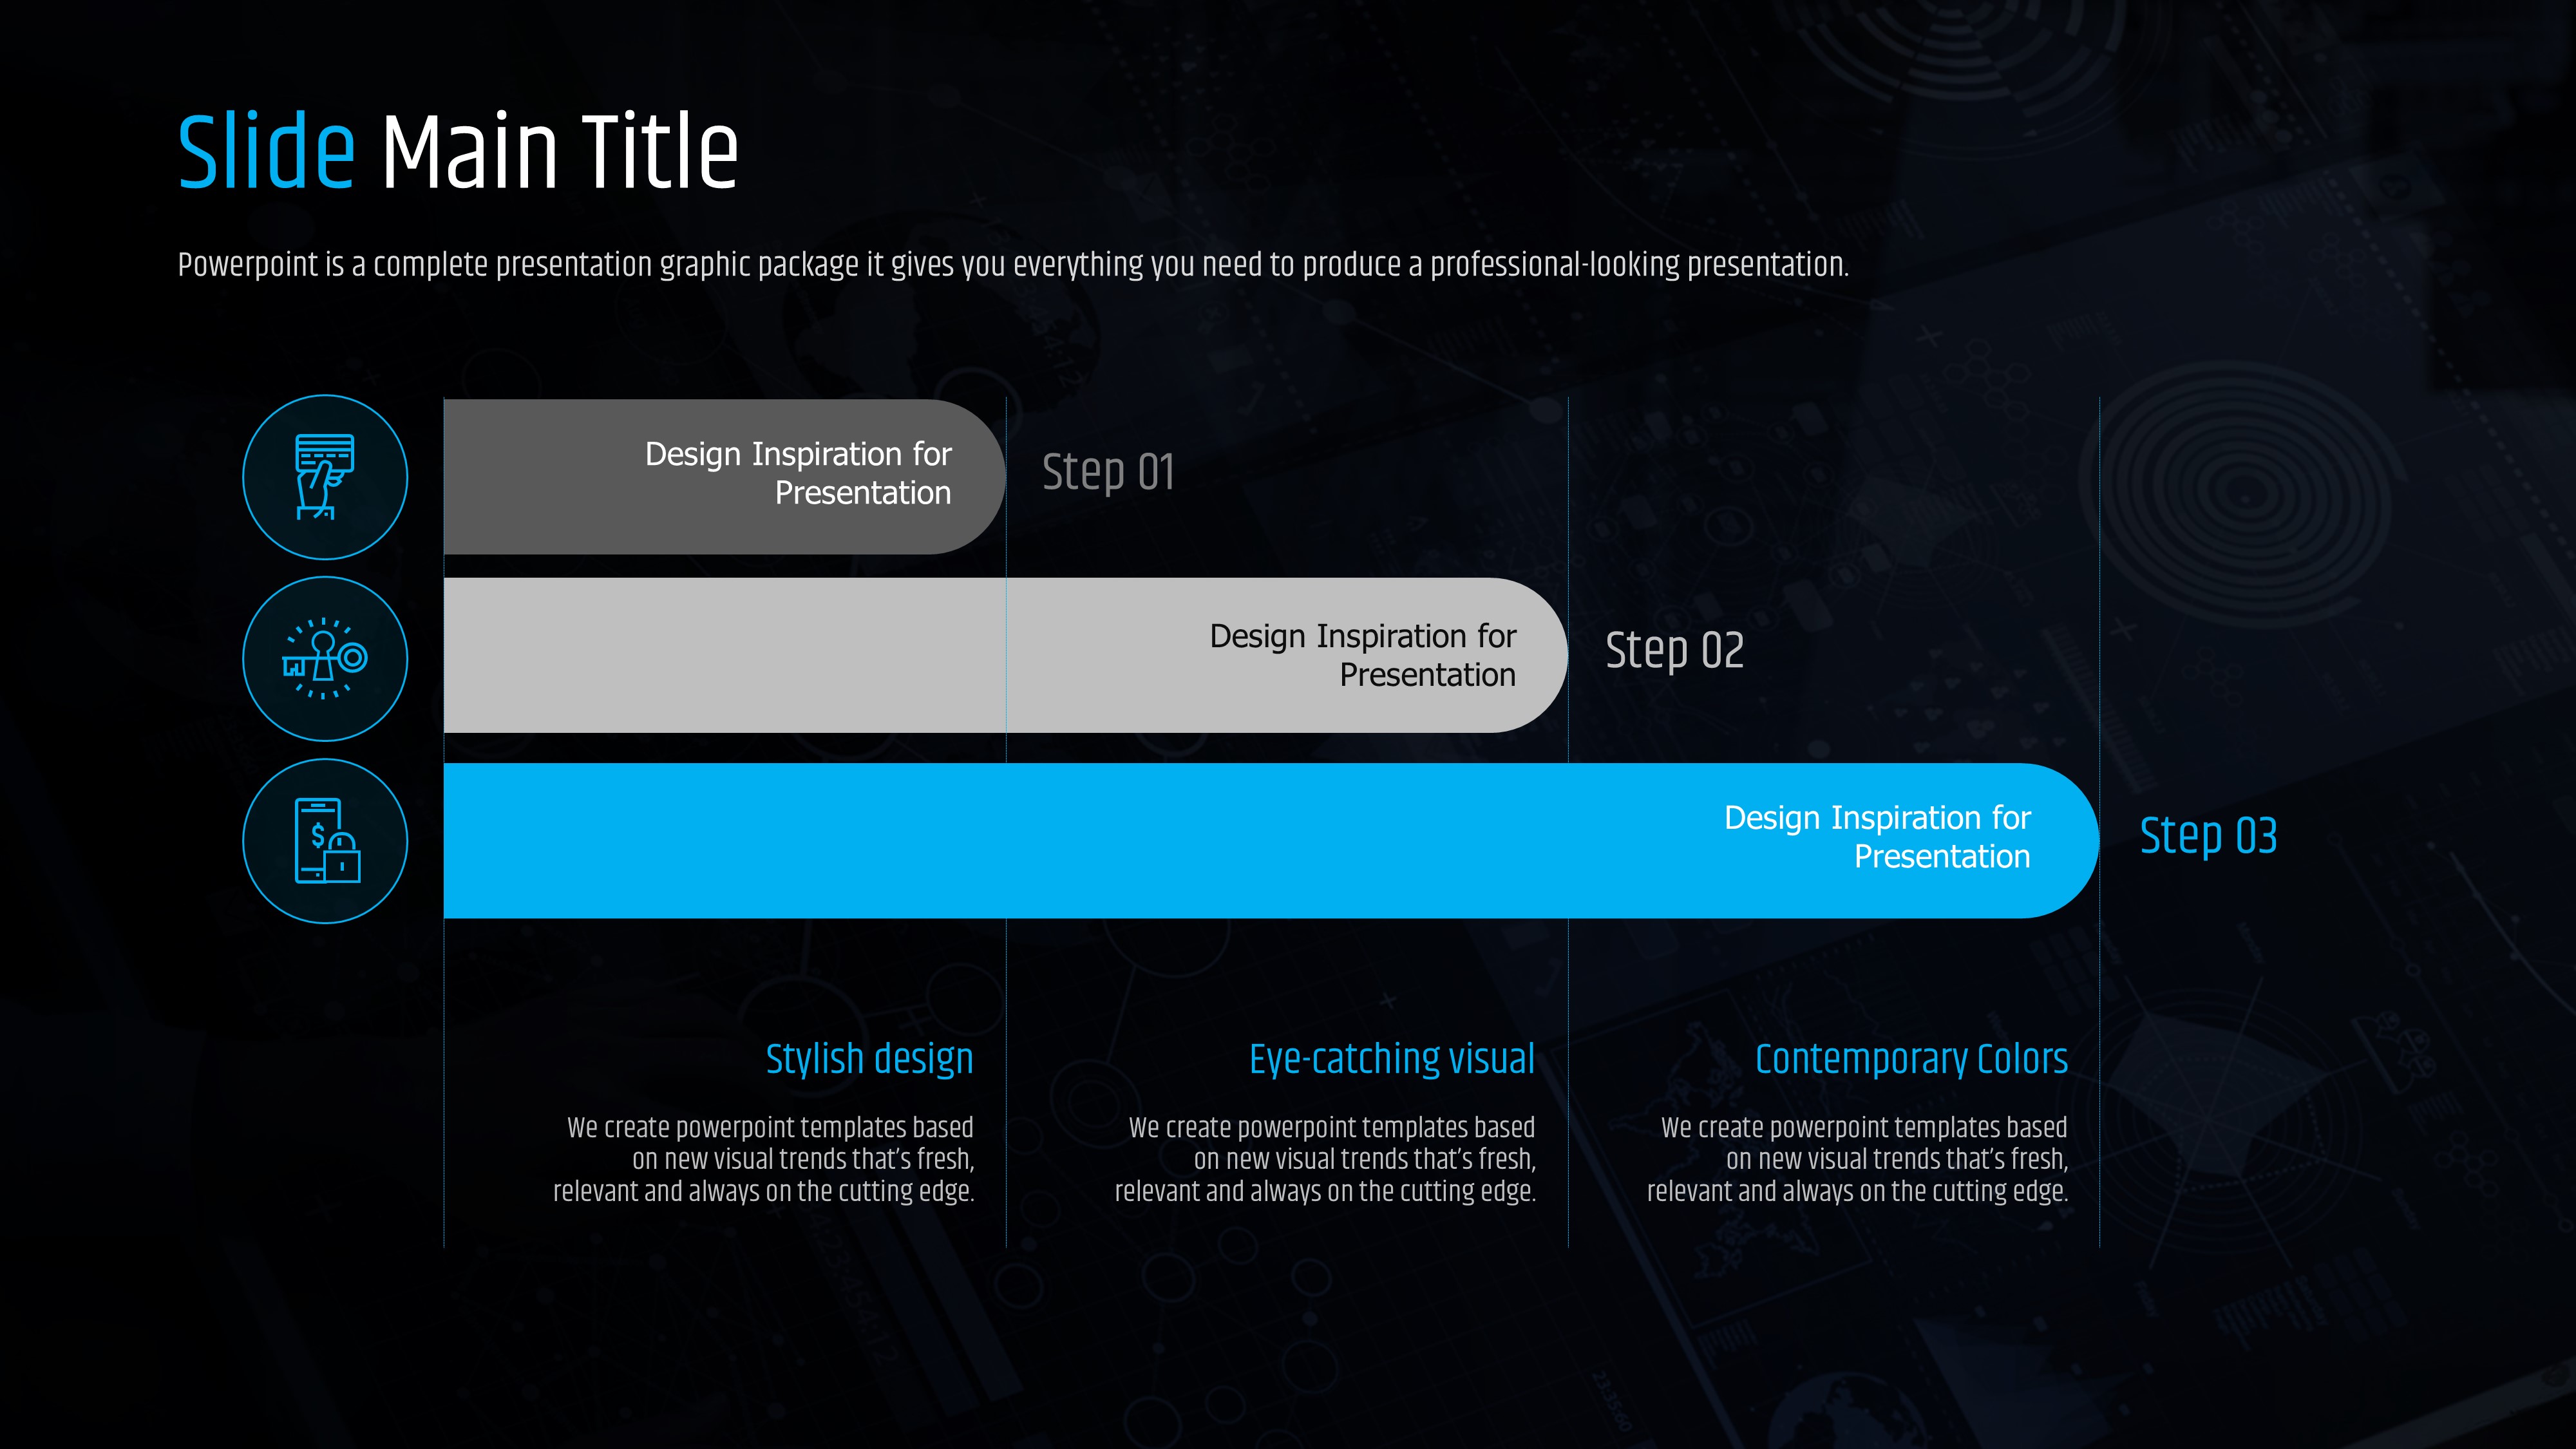
The 20-slide deck includes a title cover slide, bar chart comparison slides, circular radial diagrams, donut chart percentage indicators, a 3-step horizontal process flow, and a 4-column feature comparison layout.
Related Products
-

Smart Device Presentation Template – Merging Healthcare and Technology
#IT/Computer
-

SEO PowerPoint Wide Template – Modern and Visual-Centric Design
#IT/Computer
-

Camera APP Presentation Template – Sleek and Modern Design
#IT/Computer
-

Virtual Reality Wide Presentation Template – Modern and Stylish Design
#IT/Computer
