Financial Market Competitor Analysis Template – Emphasizing Competitive Advantage
RJ0400066_15
- Last Update 06/05/2025
- File Size 3.8MB
- # of Slides 2
- File Format PPTX
- Slide Ratio 16:9
- Color
Keywords
- #Content-Based Slides
- #Design-Based Slides
- #Market and Competitor Analysis
- #Graph
- #Competitor Analysis
- #Competitive Advantage
- #Line
- #Line Chart
- #16:9
- #line chart PowerPoint slide
- #dual-series trend comparison
- #financial data visualization template
- #competitor analysis chart
- #how to create line graph in PowerPoint
About the Product
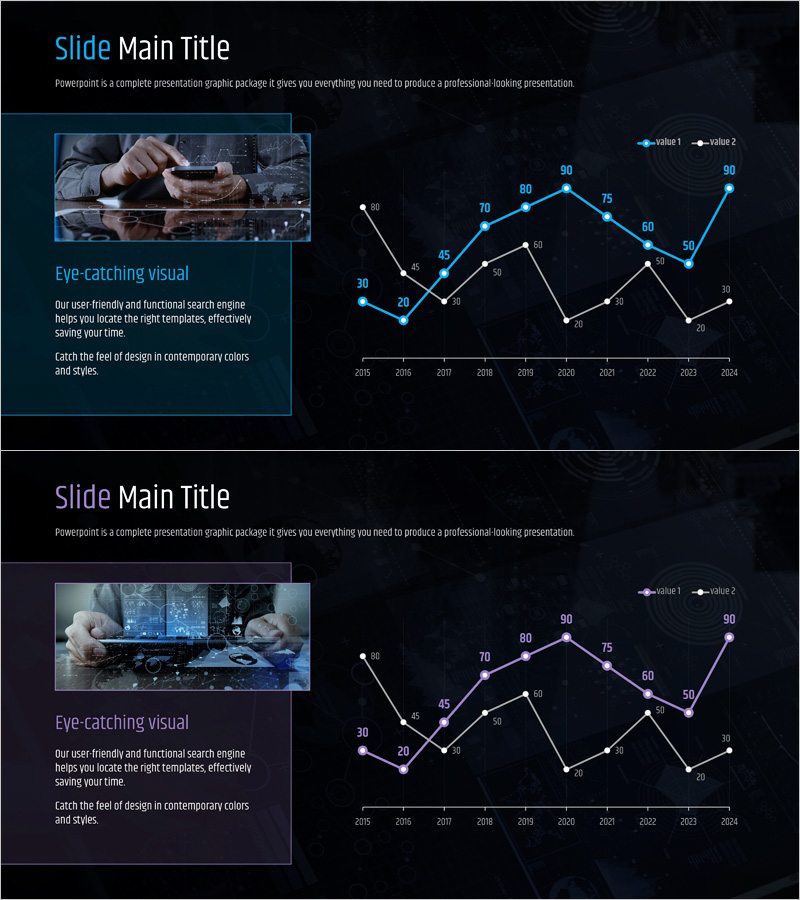
A dual-series line chart PowerPoint slide designed for financial market competitor analysis and trend comparison. This presentation template visualizes data progression from 2015 to 2024 with two distinct data series in cyan and white lines against a dark background. The slide is ready to use for business presentations, allowing you to replace sample data with actual figures for competitive advantage analysis, market share trends, revenue growth comparison, and financial performance metrics. Ideal for reports, investor presentations, and strategic planning decks.
Usage Points
-
Main Usage
Compares two or more data series over time to highlight trend changes and performance gaps. Commonly used for competitive analysis, market share evolution, revenue and profit margin trends, customer satisfaction metrics, and financial performance benchmarking in business reports and investor presentations.
-
How to Use
Select the data points and lines on the slide and replace them with your actual figures. Edit the legend labels (value 1, value 2) to match your categories, update the X-axis years and Y-axis values, then the slide is ready for your presentation.
-
Recommended For
Financial analysts, executives, marketing managers, consultants, and business strategists preparing competitor analysis reports, quarterly earnings presentations, investor briefings, board meetings, and strategic planning sessions.
-
Slide Structure
Two-slide set with identical layouts but different accent colors—cyan in the first slide and purple in the second for design flexibility. Each slide contains two data series lines, ten data points, legend labels, and axis annotations for comprehensive trend visualization.
Related Products
-

Competitor Comparative Analysis Slide – Emphasizing Market and Competitiveness
#Market and Competitor Analysis #Graph #Text Box
-

Broken Line Competitive Advantage Analysis – Market and Competitor Insights
#Market and Competitor Analysis #Graph #Competitor Analysis
-

Internet Shopping Market Comparative Analysis Graph
#Market and Competitor Analysis #Graph #Competitor Analysis
-

Blue Green Broken Line Graph – Competitor Analysis
#Market and Competitor Analysis #Graph #Competitor Analysis
