Mobile Financial Services Graph – Market and Technology Status
RJ0400066_6
- Last Update 08/27/2025
- File Size 3.2MB
- # of Slides 2
- File Format PPTX
- Slide Ratio 16:9
- Color
Keywords
- #Content-Based Slides
- #Design-Based Slides
- #Business Introduction
- #Market and Competitor Analysis
- #Graph
- #Other
- #Technological Status
- #Competitor Analysis
- #Mockup
- #16:9
- #financial services graph PowerPoint
- #market analysis presentation slide
- #financial data chart PPT
- #comparative analysis slide
- #fintech presentation template
About the Product
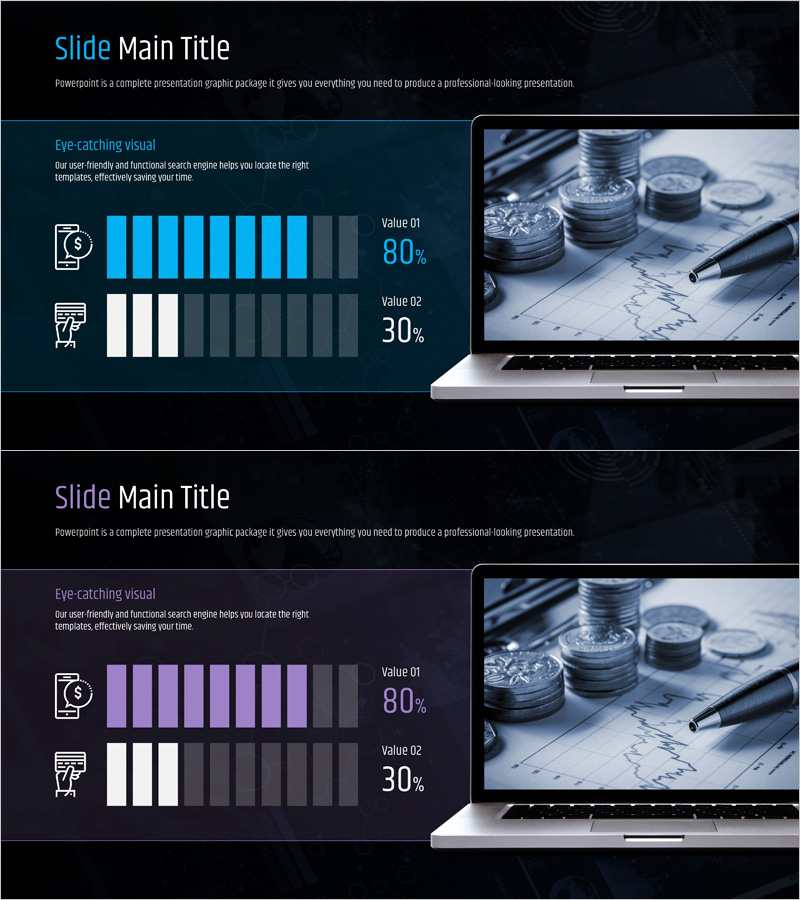
A professional PowerPoint slide designed to visualize mobile financial services market status and technology trends side by side. The dark background features cyan and purple bar charts displaying two key metrics (Value 01: 80%, Value 02: 30%) with clear visual hierarchy. An image placeholder on the right side accommodates fintech-related photography to enhance presentation credibility. Icons and text labels guide audience comprehension of data points, making it ideal for competitive analysis and market overview sections. Delivered in 16:9 PPTX format with fully editable elements for seamless customization.
Usage Points
-
Main Usage
This slide presents mobile financial services market conditions and technology trends through quantitative comparison. It serves investor pitches, executive briefings, and market analysis sections where key performance indicators require emphasis. The dual-metric layout enables simultaneous display of independent data points, strengthening decision-making narratives.
-
How to Use
Replace text labels and numerical values with your actual market data. Insert fintech or financial technology imagery into the right-side image area. Adjust chart colors (cyan and purple) to match corporate branding guidelines. Modify title and descriptive text to align with presentation context and audience requirements.
-
Recommended For
Ideal for financial institutions, fintech startups, and investment firms preparing market analysis materials. Particularly effective in executive reports, investor pitch decks, and business plans where market overview sections require data-driven credibility and visual impact.
-
Slide Structure
The slide employs a two-column layout: left side contains title, descriptive text, and two icon-based metrics with accompanying bar charts; right side provides a dedicated image placeholder for fintech-related visuals. Optimized for 16:9 widescreen presentations with balanced information hierarchy and professional spacing.
Related Products
-

Laptop Mockup Bar Graph – Essential Slide for Competitor Analysis
#Market and Competitor Analysis #Graph #Other
-

Artificial Intelligence Technology Status Analysis Graph – Market Insights and Competitor Analysis
#Business Introduction #Market and Competitor Analysis #Diagram
-

Competitor Analysis PC Mockup Graph – Market Trends and Insights
#Market and Competitor Analysis #Graph #Other
-

Visualizing Bar Graphs with PC Mockups – Competitive Market Analysis Tool
#Market and Competitor Analysis #Graph #Other
