Current Status of Financial Services System Slide – Data and Insights
RJ0400066_4
- Last Update 06/05/2025
- File Size 1.2MB
- # of Slides 2
- File Format PPTX
- Slide Ratio 16:9
- Color
Keywords
- #Content-Based Slides
- #Design-Based Slides
- #Product/Service Introduction
- #Business Vision and Strategy
- #Diagram
- #Graph
- #Other
- #Development Status
- #Core Competencies
- #Cluster
- #Chain Diagram
- #16:9
- #radial diagram PowerPoint
- #connection diagram slide
- #central expansion diagram
- #business diagram PPT
- #data visualization slide template
About the Product
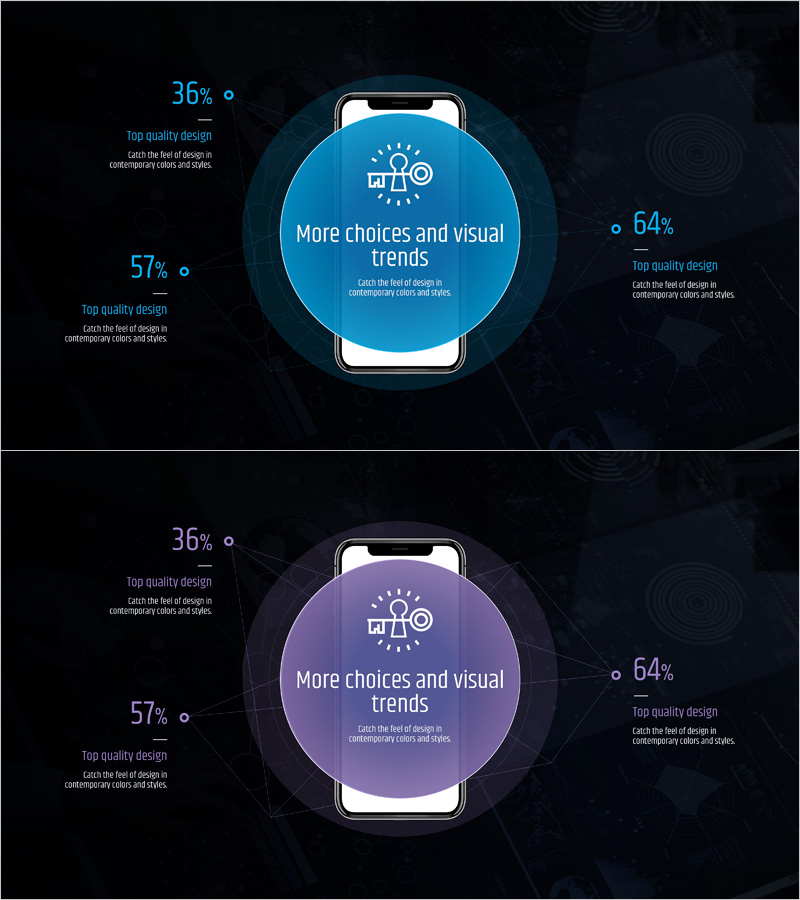
A radial connection diagram PowerPoint slide that expands from a central concept to surrounding elements. Set against a dark background, blue and purple circular nodes are arranged around a central icon, each containing percentage data and descriptive text. This 2-slide set offers color variations (blue and purple) for immediate use in presentations, business strategy documents, and data analysis materials. Available in 16:9 widescreen PPTX format, fully editable in all PowerPoint versions.
Usage Points
-
Main Usage
Optimized for visualizing relationships between a core concept and its derived elements. With three radial nodes arranged around a central icon, it effectively communicates business strategies, system architectures, organizational relationships, marketing channel analysis, and other information hierarchies across diverse contexts.
-
How to Use
Open the slide and replace the central icon and node text with your own content. Percentage values can be adjusted to match your data, and node colors and background can be customized to align with corporate branding. Two color variations (blue and purple) allow you to apply different colors across presentation sections for visual variety.
-
Recommended For
Ideal for business strategy presentations in finance, IT, and consulting sectors, system architecture explanations, organizational structure introductions, marketing channel analysis, and data insight sharing. Suitable for executive reports, investor pitches, internal training materials, and client proposals requiring professional presentation standards.
-
Slide Structure
2-slide set featuring identical radial structures in blue and purple tones. Each slide comprises one central icon, three radially arranged nodes, percentage data, and descriptive text areas for each node. Optimized in 16:9 widescreen format for contemporary presentation environments.
Related Products
-

Chemical Experiment Research Analysis Diagram – Innovation and Progress
#Company Introduction #Product/Service Introduction #Diagram
-

Competitive Strengths Comparison Chart – An Effective Market Analysis Tool
#Product/Service Introduction #Market and Competitor Analysis #Diagram
-

Map of Korean Market Development Status
#Product/Service Introduction #Marketing Plan and Strategy #Diagram
-

Musicians and Gauge Charts Slide – The Uniqueness of Data Visualization
#Product/Service Introduction #Business Introduction #Graph
