Analyze Market Share Using Financial Services Development Status Graph
RJ0400066_11
- Last Update 06/05/2025
- File Size 1.1MB
- # of Slides 2
- File Format PPTX
- Slide Ratio 16:9
- Color
Keywords
- #Content-Based Slides
- #Design-Based Slides
- #Product/Service Introduction
- #Market and Competitor Analysis
- #Graph
- #Development Status
- #Market Share
- #Circles
- #Doughnut Chart
- #16:9
- #donut chart PowerPoint slide
- #pie chart template download
- #market share analysis PPT
- #financial data visualization
- #ratio comparison slide template
About the Product
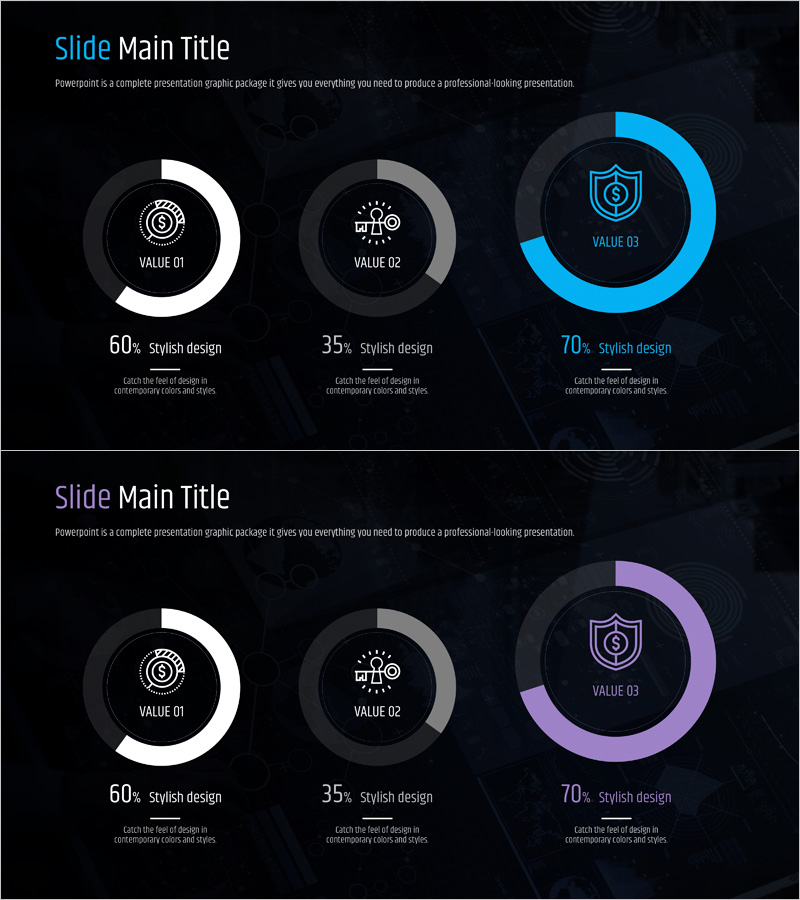
A donut chart PowerPoint slide designed for financial services market share analysis. Three donut graphs with white, gray, and cyan blue accents on a dark background intuitively display the proportion of three data segments. Each donut features an icon and label to clearly visualize financial data structure. Composed of 2 slides optimized for 16:9 widescreen format. Ready to use in the data visualization section of financial presentations, business plans, investor pitch decks, and market analysis reports.
Usage Points
-
Main Usage
Visualize 3-4 segment ratio data such as market share, customer composition, or revenue distribution using donut charts to clearly communicate market position to executives, investors, and stakeholders.
-
How to Use
Edit the chart values and labels with your own data. Adjust segment colors, sizes, and icons to emphasize key metrics. Insert into the market analysis section of financial reports, business plans, or investor presentations.
-
Recommended For
Finance and insurance professionals, fintech founders, business executives, investor relations managers, and marketing strategists who need to present market share, customer distribution, or revenue composition persuasively.
-
Slide Structure
2-slide set. Each slide features a dark background with 3 donut charts arranged horizontally. First donut has white accent, second gray, third cyan blue. Each donut displays a central icon and label (VALUE 01-03), with percentage and description text below.
Related Products
-

Map Donut Graph for Visualizing Market Share – Symbol of Practicality and Change
#Product/Service Introduction #Market and Competitor Analysis #Graph
-

City Theme Market Share Graph – Business Data Visualization
#Product/Service Introduction #Market and Competitor Analysis #Graph
-

Development Status Analysis Donut Chart – Market Share Visualization
#Product/Service Introduction #Market and Competitor Analysis #Graph
-

Website Technology Development Status Graph – Market Share and Trends
#Product/Service Introduction #Market and Competitor Analysis #Graph
