Mobile Finance Process Cycle Diagram
RJ0400066_9
- Last Update 06/05/2025
- File Size 1.1MB
- # of Slides 2
- File Format PPTX
- Slide Ratio 16:9
- Color
Keywords
- #Content-Based Slides
- #Design-Based Slides
- #Business Introduction
- #Operational Plan
- #Diagram
- #Business Areas
- #Business Processes
- #Flow
- #Circular Flow
- #16:9
- #cycle diagram PowerPoint
- #mobile finance process slide
- #5-step circular diagram
- #PowerPoint process visualization
- #financial services presentation template
About the Product
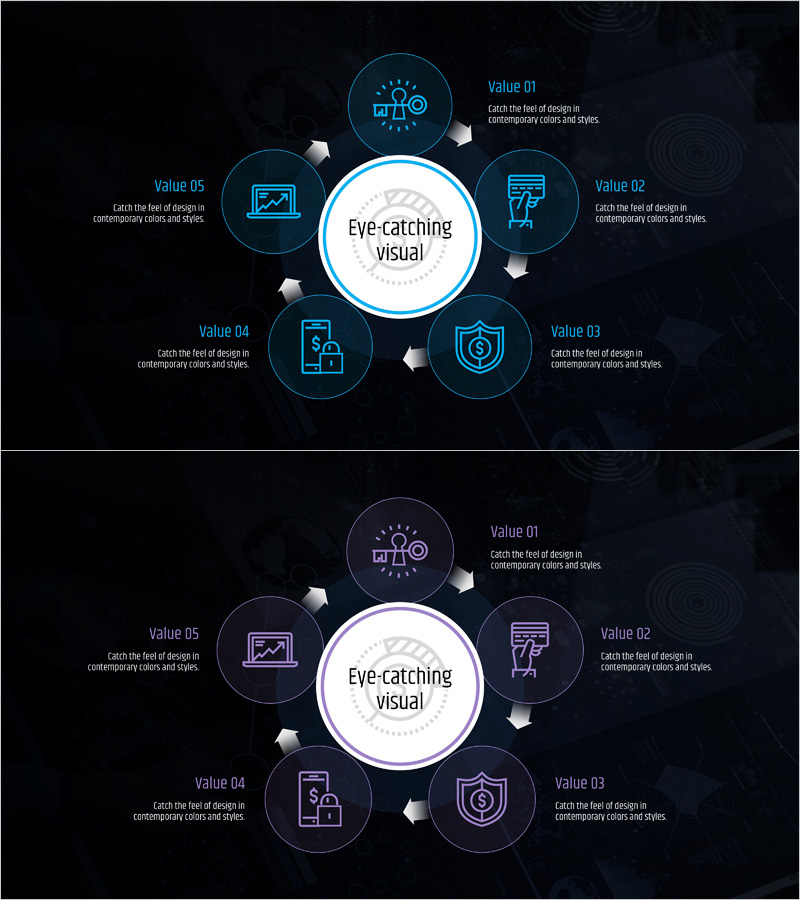
A radial cycle diagram PowerPoint slide visualizing the 5-step mobile finance process with a central white circle and cyan blue circular nodes radiating outward on a dark navy background. Each node features an icon (strategy, analysis, security, finance, technology) representing key process stages. The slide includes two color variations (cyan and purple) for flexible presentation design. Ideal for financial services pitches, business process explanations, and project briefings in banking and fintech sectors.
Usage Points
-
Main Usage
Visualizes the mobile finance service workflow through a 5-step radial cycle structure, enhancing audience comprehension. The central hub-and-spoke layout clearly communicates process flow and interdependencies, while distinct icons differentiate finance, technology, security, analysis, and strategy domains, simplifying complex financial processes for stakeholder communication.
-
How to Use
Deploy in financial institution business presentations, mobile app development kickoff meetings, fintech service process training, and investor pitch decks. Customize node text to match your organization's specific workflow, select color variant (cyan or purple) to align with corporate branding, and integrate into multi-slide presentations for comprehensive process documentation.
-
Recommended For
Finance and fintech company executives, product managers, development teams, mobile banking service leads, financial consultants, business development professionals, investment pitch presenters, process improvement project managers, and financial training instructors seeking professional process visualization.
-
Slide Structure
Central white circle with 'Eye-catching visual' text anchors the design. Five equally-sized cyan circular nodes with icons and 'Value 01–05' labels radiate outward at cardinal and intercardinal positions. White connecting lines and directional arrows link nodes in clockwise sequence, emphasizing circular workflow. Both slides maintain identical structure with cyan and purple color variants.
Related Products
-

Healthcare System Process Diagram – Efficient Workflow
#Business Introduction #Operational Plan #Diagram
-

Online Shopping Mall Delivery Process Diagram – Visual Enhancement for Operational Efficiency
#Business Introduction #Operational Plan #Diagram
-

Scientific Experiment Process Cycle Diagram – Effective Business Introduction
#Business Introduction #Operational Plan #Diagram
-

Circular Diagram Service Implementation Plan
#Operational Plan #Technical Approach #Diagram
