
Business Solution Presentation Template - Stylish Wide Design
J0300089
- Last Update 08/29/2025
- File Size 22.2MB
- # of Slides 21
- File Format PPTX
- Slide Ratio 16:9
- Color
Slide Preview


Keywords
About the Product
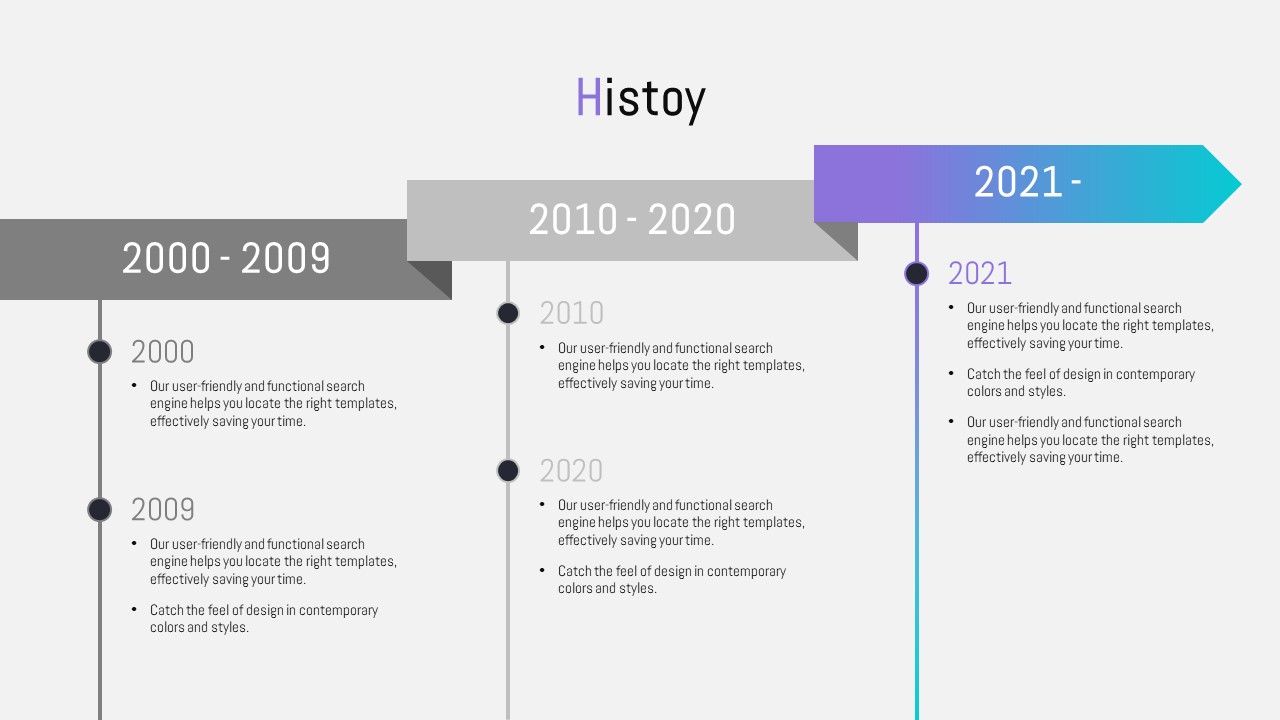
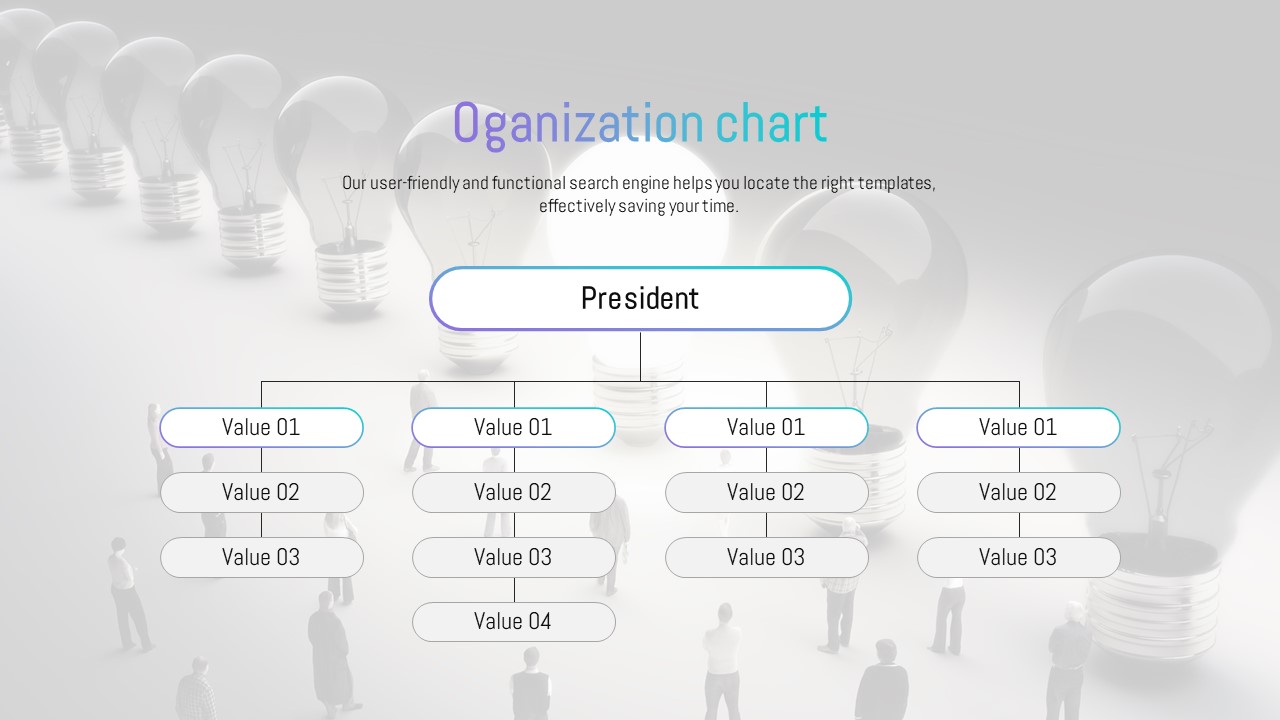
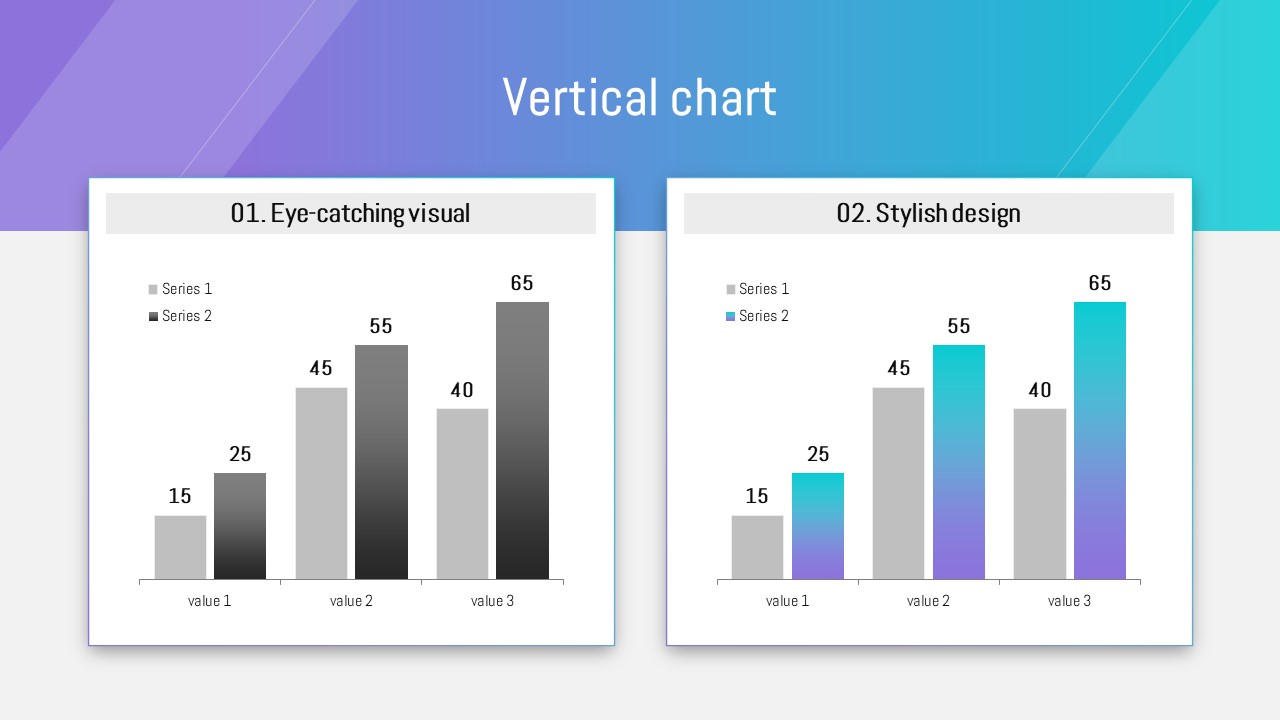
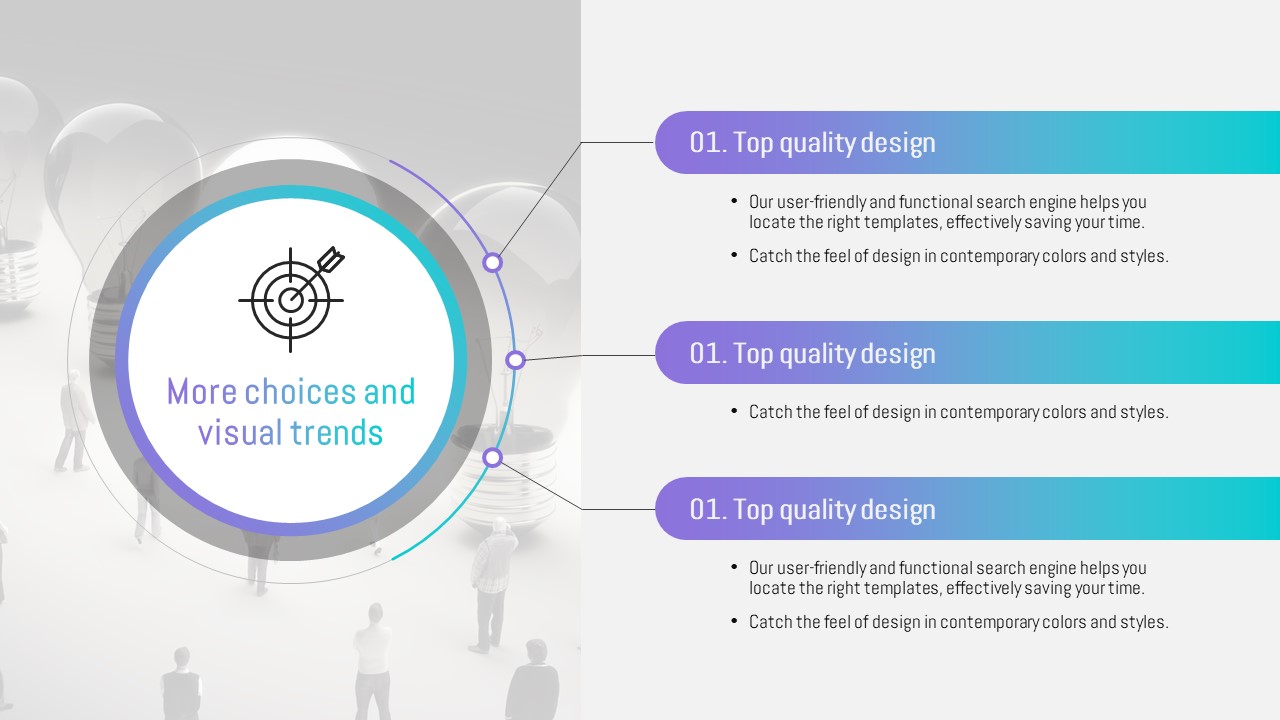
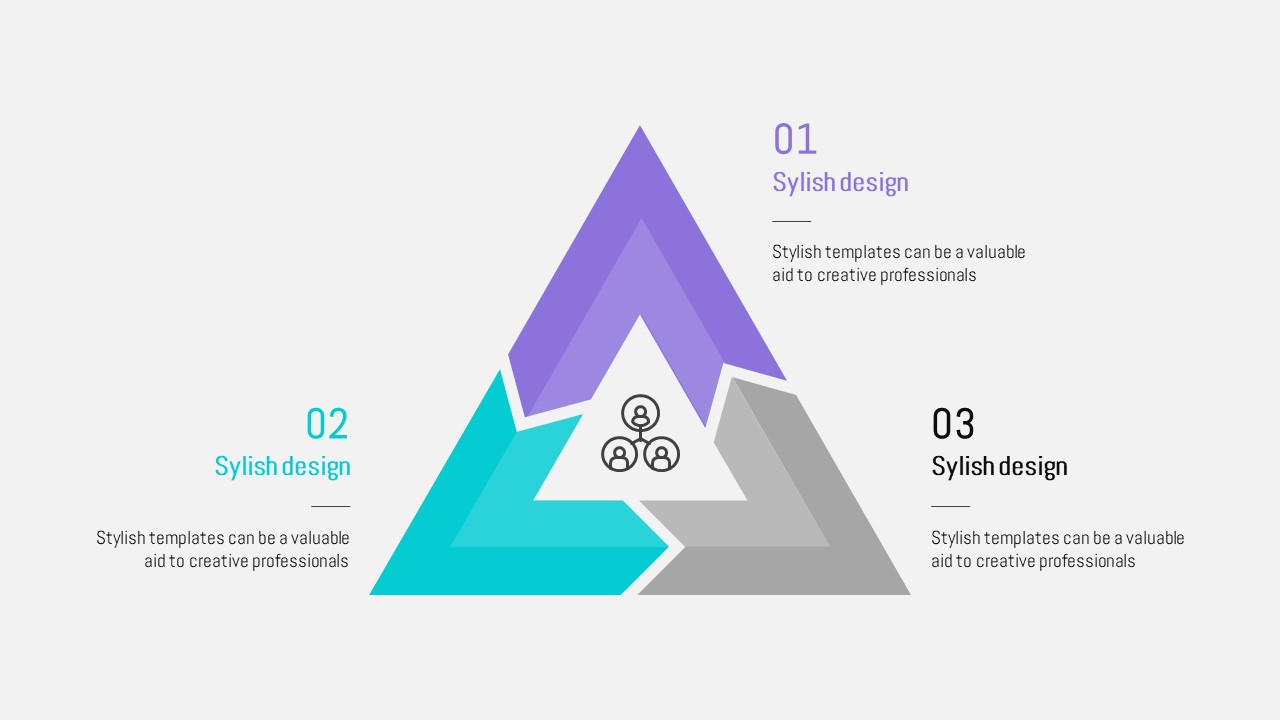
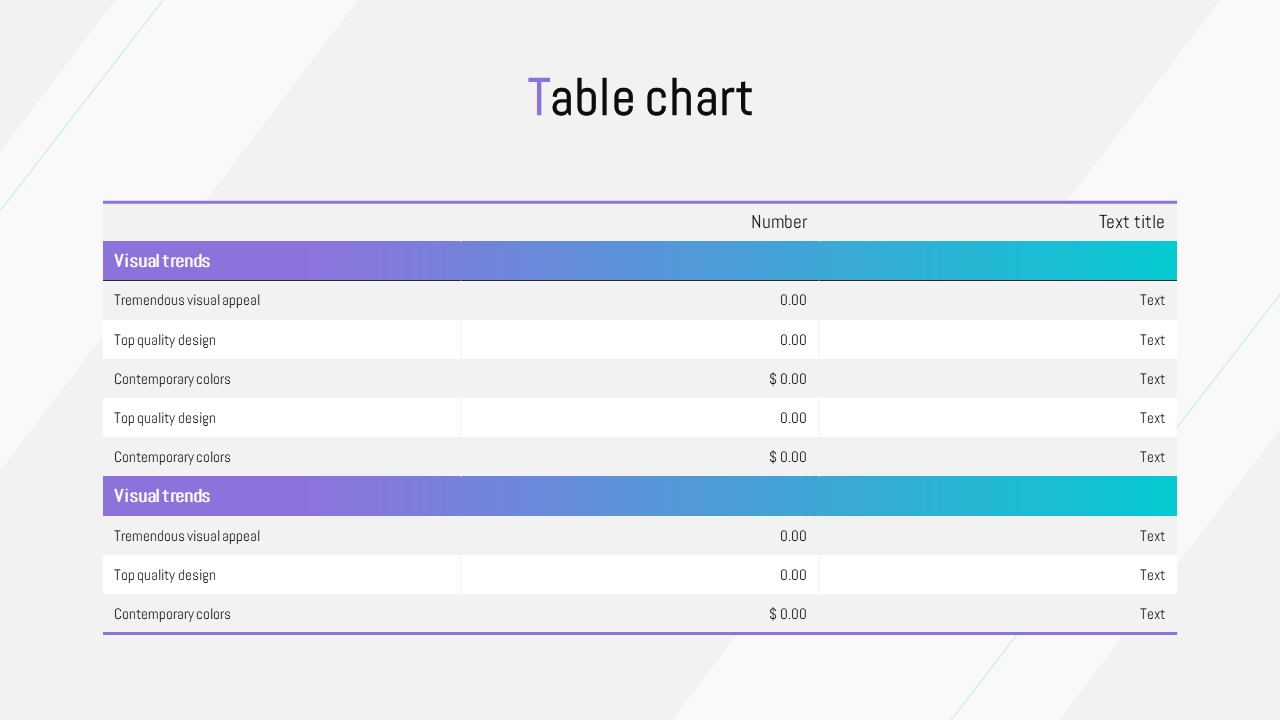
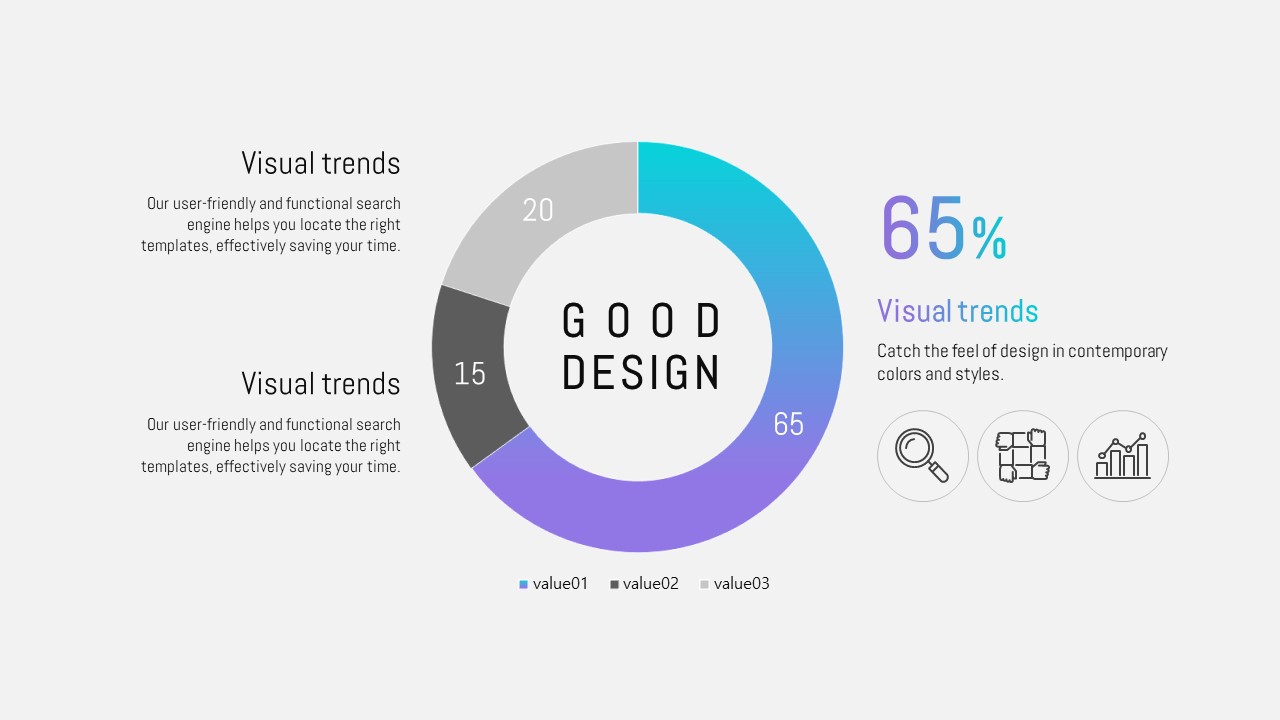
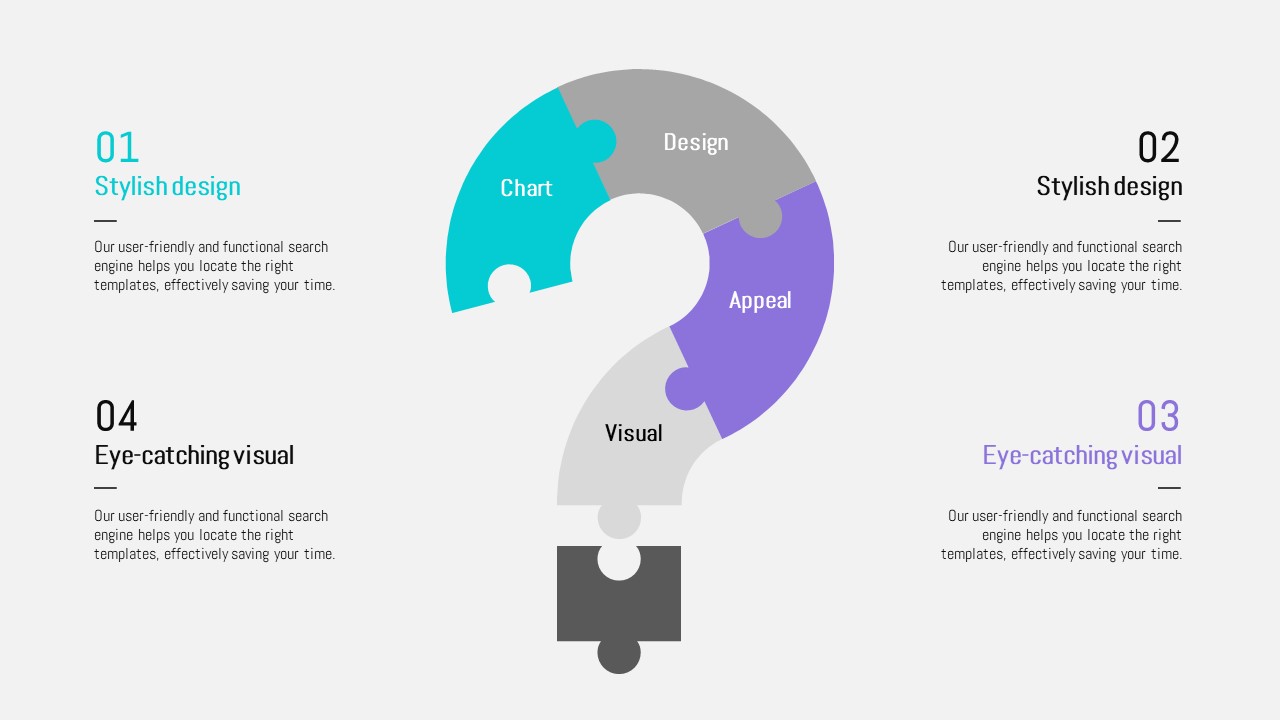
A professional business solution PowerPoint template featuring a bold purple-to-cyan gradient accent with a dynamic diagonal split layout. The cover slide uses a dark charcoal background with a striking 3D question-mark visual, while body slides shift to a clean light-gray background for maximum readability. This 21-slide presentation deck includes a horizontal arrow timeline, vertical bar charts for data comparison, a triangular three-step diagram, a donut chart for percentage breakdowns, and a puzzle-style composition slide. Line-style icons and a two-column grid layout keep information structured and easy to follow. Fully editable in PPTX format, this template is ready to use for strategy proposals, solution pitches, business reviews, and client presentations. Ideal for consultants, planners, and sales professionals who need a polished, data-driven slide deck.
Usage Points
-
Main Usage
Designed for strategy solution proposals, business reviews, and service introduction presentations. The 21-slide structure covers all key sections from cover to data visualization, making it suitable for client pitches and investor meetings.
-
How to Use
Download the PPTX file and replace the placeholder text, company name, logo, and data values. Insert your historical milestones into the timeline slide and input actual figures into the bar and donut chart slides to complete a polished presentation.
-
Recommended For
Best suited for business consultants, strategic planners, IT solution sales teams, and marketing professionals who need a credible and visually structured deck for client-facing or internal executive presentations.
-
Slide Structure
Includes a 3D visual cover with diagonal split, a 3-phase horizontal arrow timeline, two vertical bar chart slides for comparison, a triangular 3-step diagram, a donut chart for percentage data, and a puzzle-style layout slide — 21 slides total.
Related Products
-

Business Partnership PowerPoint Template – Build Trust with Elegant Design
#Business
-

Opinion PPT Wide – Stylish Design for Effective Presentations
#Business
-

Idea Wide Presentation Template – Modern and Visual Design
#Business
-

Multitasking Presentation Template – Optimized Design for Business
#Business
