Area Graph for Competitor Analysis
RJ0300089_10
- Last Update 05/14/2025
- File Size 0.3MB
- # of Slides 2
- File Format PPTX
- Slide Ratio 16:9
- Color
Keywords
- #Content-Based Slides
- #Design-Based Slides
- #Market and Competitor Analysis
- #Marketing Plan and Strategy
- #Graph
- #Other
- #Target Market
- #Target Market Strategy
- #Circles
- #Doughnut Chart
- #Map
- #16:9
- #infographic chart PowerPoint
- #area chart template
- #competitor analysis slide
- #marketing data visualization
- #comparison chart design
- #how to create area chart in PowerPoint
About the Product
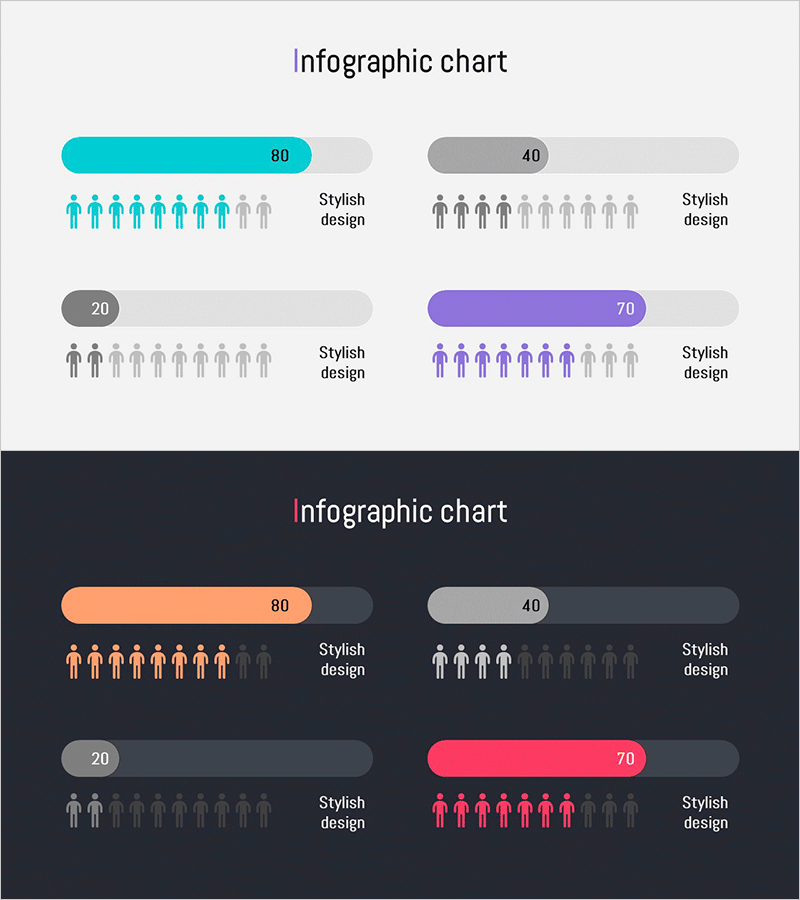
An infographic area chart PowerPoint slide designed for competitor analysis and marketing strategy presentations. This template features two background versions—light and dark—with five color series (cyan, orange, gray, purple, and pink) to visualize up to four data metrics simultaneously. Each series includes human icons for visual emphasis, horizontal progress bars, and percentage labels to convey comparative analysis intuitively. Delivered in 16:9 widescreen PPTX format, fully editable and ready for immediate use in marketing reports, sales presentations, and executive briefings.
Usage Points
-
Main Usage
Compares up to four key metrics—such as market share, customer satisfaction, sales performance, and brand awareness—across competitors. Human icons and color differentiation clearly distinguish each data series, while horizontal progress bars provide percentage-based comparison at a glance.
-
How to Use
Use in marketing strategy meetings, executive reports, and sales presentations to explain competitive positioning. The light background version suits bright conference rooms and projector environments, while the dark version works well in dimly lit spaces and online video conferences. Simply input your data values for immediate deployment.
-
Recommended For
Marketing managers, sales directors, executives, management consultants, and business analysts presenting competitive analysis findings. Ideal for B2B proposals, quarterly performance reports, market research presentations, and strategic planning sessions.
-
Slide Structure
Two-slide layout. Title area at top, four infographic blocks in center (each containing numeric value, human icons, horizontal progress bar, and percentage display). 'Stylish design' label on left side. Both light background (gray and white tones) and dark background (black and charcoal tones) versions included.
Related Products
-

Slide Visualizing America with Contemporary Colors
#Market and Competitor Analysis #Marketing Plan and Strategy #Graph
-

Infographic Slide for Regional Data Visualization
#Market and Competitor Analysis #Marketing Plan and Strategy #Graph
-

Analysis of European Target Regions – Insights for Marketing Strategy Development
#Market and Competitor Analysis #Marketing Plan and Strategy #Graph
-

Graph of the Status of European Target Region Analysis – Market Trends Visualization
#Market and Competitor Analysis #Marketing Plan and Strategy #Graph
