Energy Business Process – Visualization of Strategic Operating Plan
RJ0300089_7
- Last Update 05/14/2025
- File Size 0.2MB
- # of Slides 2
- File Format PPTX
- Slide Ratio 16:9
- Color
Keywords
- #Content-Based Slides
- #Design-Based Slides
- #Business Strategy
- #Operational Plan
- #Diagram
- #Graph
- #Step-by-Step Schedule Plan
- #Business Processes
- #Cluster
- #Column
- #Chain Diagram
- #Grouped Column
- #16:9
- #grouped bar chart PowerPoint
- #bar graph slide template
- #2-series data comparison
- #numerical analysis presentation
- #how to create grouped bar chart in PowerPoint
About the Product
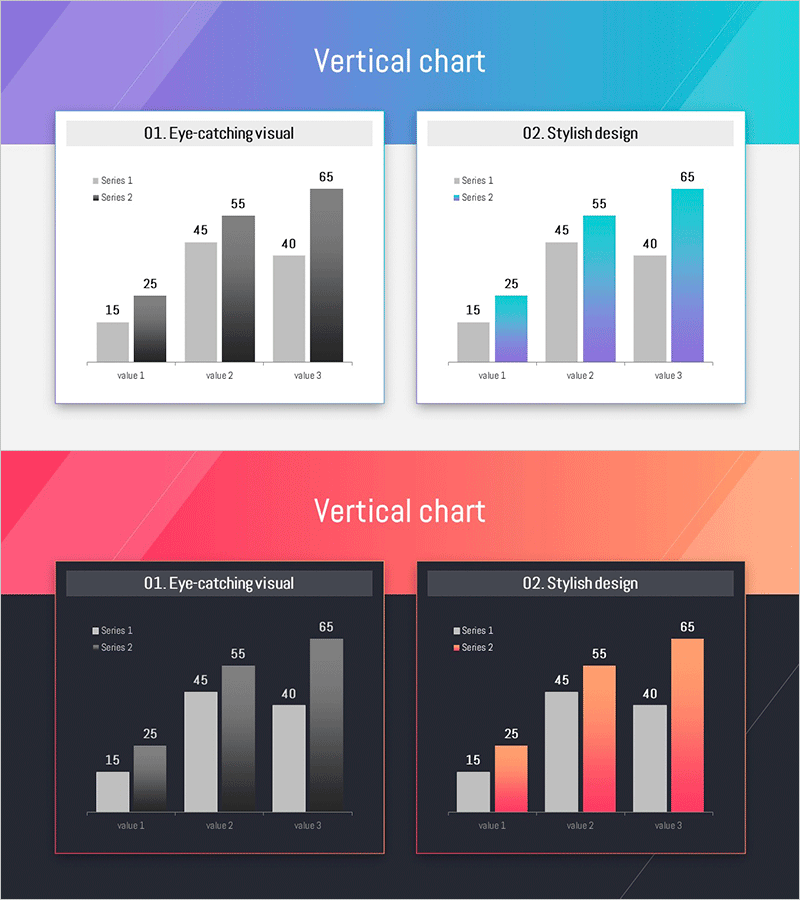
A grouped bar chart PowerPoint slide designed for energy business strategy presentations and operational performance analysis. This template displays two data series across three items side-by-side, enabling intuitive numerical comparison and results visualization. Two design options are provided: a light-toned version with gray and teal gradient backgrounds, and a dark-toned version with black background and pink-orange accent colors. Each slide includes legend, data labels, and clear axis structure for maximum readability. Fully editable PPTX format allows instant customization for your specific data and branding.
Usage Points
-
Main Usage
Ideal for comparing two key metrics—such as operational performance vs. targets, departmental results, or quarterly achievements—across multiple categories. The grouped bar layout allows viewers to instantly grasp the difference between two data series within each item, making it effective for data-driven decision-making presentations.
-
How to Use
Insert this slide into strategy meetings, quarterly performance reports, investor presentations, and executive briefings where numerical comparison is essential. Customize the legend and axis labels to match your data, then adjust bar heights and colors to emphasize key findings and trends.
-
Recommended For
Energy, power, and utility industry planners; operations managers; financial analysts; and executive reporting teams presenting performance metrics, goal attainment, and departmental comparisons. Suitable for any business presentation requiring quantitative data visualization and multi-series analysis.
-
Slide Structure
2-slide set. Slide 1: Light background (purple-to-teal gradient) with gray and dark gray 2-series bars across 3 items, including legend, data labels, and axis. Slide 2: Dark background (black) with gray, pink, and orange gradient 2-series bars in identical layout. 16:9 widescreen format, fully editable PPTX.
Related Products
-

Joint Business Development Phase Slide – Effective Operating Plan
#Business Strategy #Operational Plan #Diagram
-

4STEP Circular Connection Diagram – Business Execution Strategy
#Business Strategy #Operational Plan #Diagram
-

Science Experiment Schedule Connection Diagram
#Business Strategy #Operational Plan #Diagram
-

Service Business Process Diagram – Efficient Business Advancement
#Business Strategy #Operational Plan #Diagram
