Energy Power Plant Template – Modern Design and Usability
RJ0300089_13
- Last Update 05/14/2025
- File Size 0.3MB
- # of Slides 2
- File Format PPTX
- Slide Ratio 16:9
- Color
Keywords
About the Product
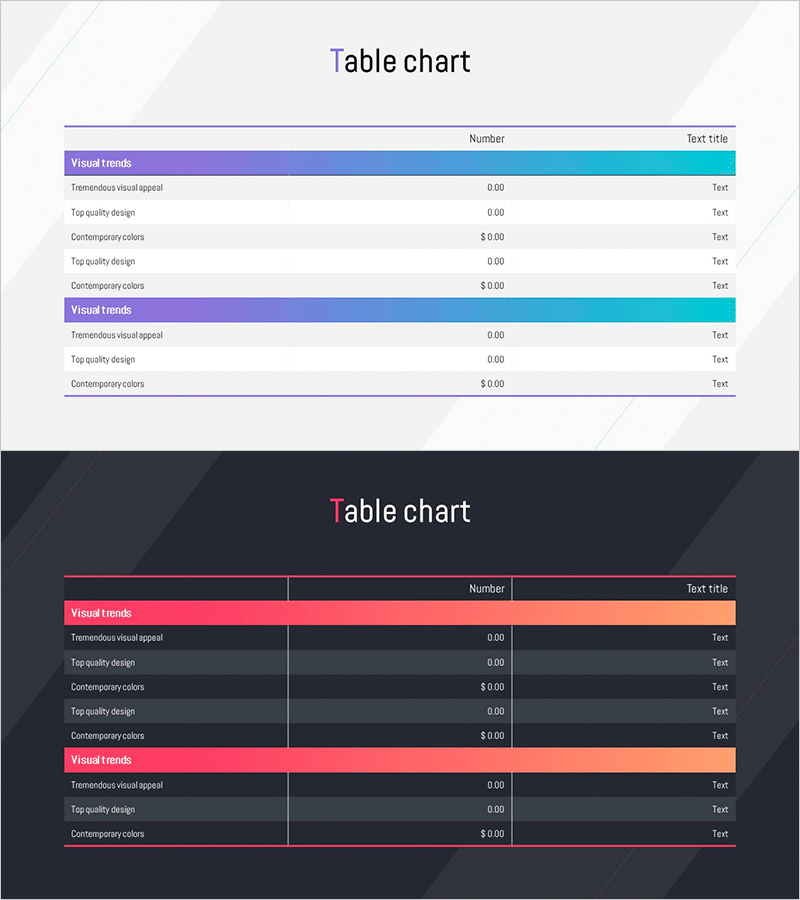
A professional table chart PowerPoint slide designed for comparing Visual Trends data at a glance. Features a blue and pink gradient header that enhances visual distinction, with numerical data and text descriptions arranged in a three-column layout. Optimized for 16:9 widescreen format in a 2-slide set, ready for immediate use in financial reports, market analysis, and performance evaluation presentations. The editable table structure allows you to input your own data effortlessly, with two design options: light background and dark background versions for flexible presentation environments.
Usage Points
-
Main Usage
Visualizes numerical information such as financial metrics, market data, and performance indicators in a structured table format to enhance audience comprehension. Delivers critical data clearly in IR materials, management reports, and marketing analysis presentations where category-by-category comparison is essential.
-
How to Use
Simply enter your numerical data and descriptive text into the table cells. Replace the Visual Trends header text with your category names and update the Number and Text title columns with your data. Choose between the light or dark background version based on your presentation environment and document tone.
-
Recommended For
Ideal for finance teams presenting income statements and balance sheets, marketing teams analyzing market share and customer satisfaction, executives delivering quarterly and annual performance reports, and consulting firms presenting benchmarking data comparisons.
-
Slide Structure
Two-slide set, each featuring a three-column table layout (category, number, description). Headers are highlighted with a blue-to-pink gradient, while data rows alternate between white and gray backgrounds for improved readability. Each slide contains two data groups (Visual Trends) to support comparative analysis and data-driven decision-making.
Related Products
-

City Line Theme Proposal Section – Steps to Success
#Slide Type #Section Cover
-

Chess Themed Business Strategy Template Section Slide
#Slide Type #Section Cover
-

Asset Management Business Plan Template Section Slide – Infused with Professionalism and Trust
#Slide Type #Section Cover
-

Logistics Business Plan Template Cover
#Slide Type #Section Cover
