Current Status of Energy Business Development – Pie Chart for Business Intro
RJ0300089_9
- Last Update 05/14/2025
- File Size 1.4MB
- # of Slides 2
- File Format PPTX
- Slide Ratio 16:9
- Color
Keywords
- #Content-Based Slides
- #Design-Based Slides
- #Product/Service Introduction
- #Business Introduction
- #Graph
- #Composition
- #Technological Status
- #Circles
- #Pie Chart
- #16:9
- #radial pie diagram PowerPoint
- #3-section pie chart slide
- #business status analysis presentation
- #energy sector template
- #pie chart PowerPoint template download
About the Product
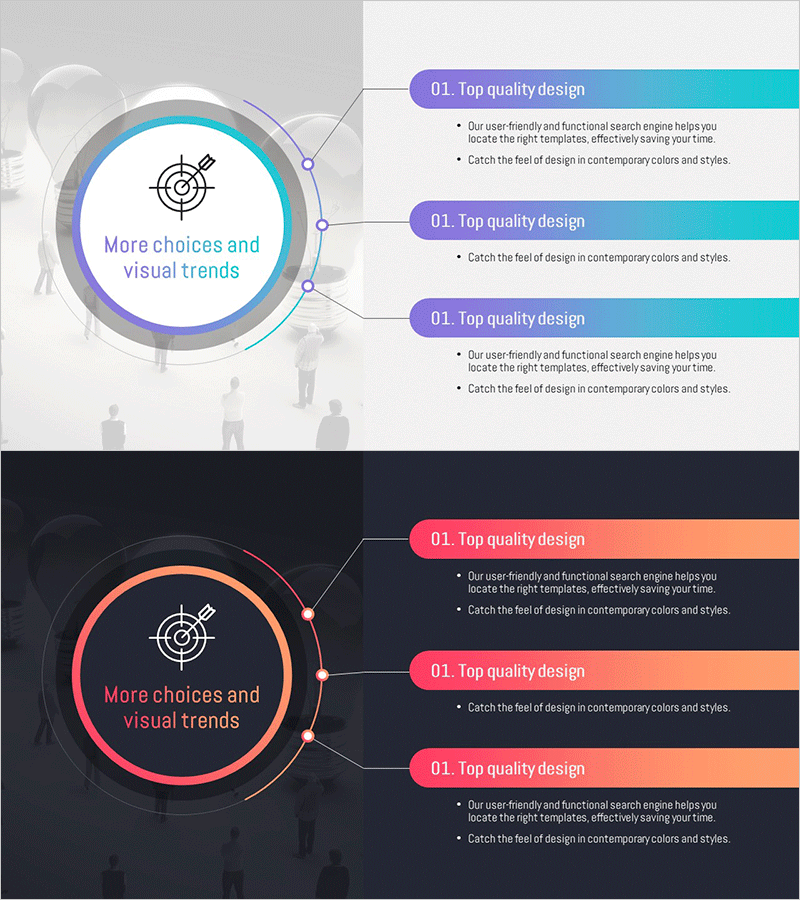
A radial pie diagram PowerPoint slide that visualizes energy business development status across three key sections. The design features a central target icon with three callout bubbles radiating outward. The top version uses a light color scheme with gray, blue, and cyan gradients, while the bottom version employs a dark theme with black, orange, and pink gradients. Each section accommodates text and detailed descriptions, making it ideal for business introductions, strategy presentations, and performance analysis. Includes 2 slides in 16:9 aspect ratio, PPTX format.
Usage Points
-
Main Usage
Communicates business development status, strategic initiatives, and performance metrics across three core components. The central target icon emphasizes the main theme, while three radial sections clearly illustrate relationships and balance among key elements. Optimized for industry-specific status analysis in energy, infrastructure, and emerging business sectors.
-
How to Use
Input business division names, development stages, or performance indicators into each callout bubble. Select the light theme to convey growth and positive momentum, or the dark theme to emphasize credibility and expertise. Maintain consistent color schemes throughout the presentation or use contrasting themes to enhance visual impact.
-
Recommended For
Ideal for energy, power, gas, and renewable energy companies presenting at business briefings, investor pitches, executive reports, and strategic planning sessions. Recommended for business development teams, strategic planning departments, and marketing teams sharing portfolio compositions and performance achievements.
-
Slide Structure
2-slide set. Top slide features light background (gray, blue, cyan gradients) with centered circular frame and three radial callout bubbles. Bottom slide applies dark background (black, orange, pink gradients) with identical layout structure. Each callout bubble is independently editable, while the central target icon remains fixed to maintain visual consistency.
Related Products
-

Stylish Design Visual – Effective Presentation Material
#Product/Service Introduction #Business Introduction #Graph
-

Business Analysis Pie Chart
#Product/Service Introduction #Market and Competitor Analysis #Graph
-

Clock Image Shape Diagram – Product Status Presentation
#Product/Service Introduction #Diagram #Graph
-

Composition Content Bar Graph – Information Delivery and Analysis
#Product/Service Introduction #Business Introduction #Graph
