Visualizing Power Plant Locations – Key Insights for the Energy Business
RJ0300089_16
- Last Update 05/14/2025
- File Size 1.5MB
- # of Slides 2
- File Format PPTX
- Slide Ratio 16:9
- Color
Keywords
- #Content-Based Slides
- #Design-Based Slides
- #Product/Service Introduction
- #Technical Approach
- #Diagram
- #Composition
- #Service Components
- #Cluster
- #Chain Diagram
- #16:9
- #circular diagram PowerPoint
- #4-section connection slide
- #business analysis presentation
- #energy sector slide template
- #diagram PowerPoint slide design
About the Product
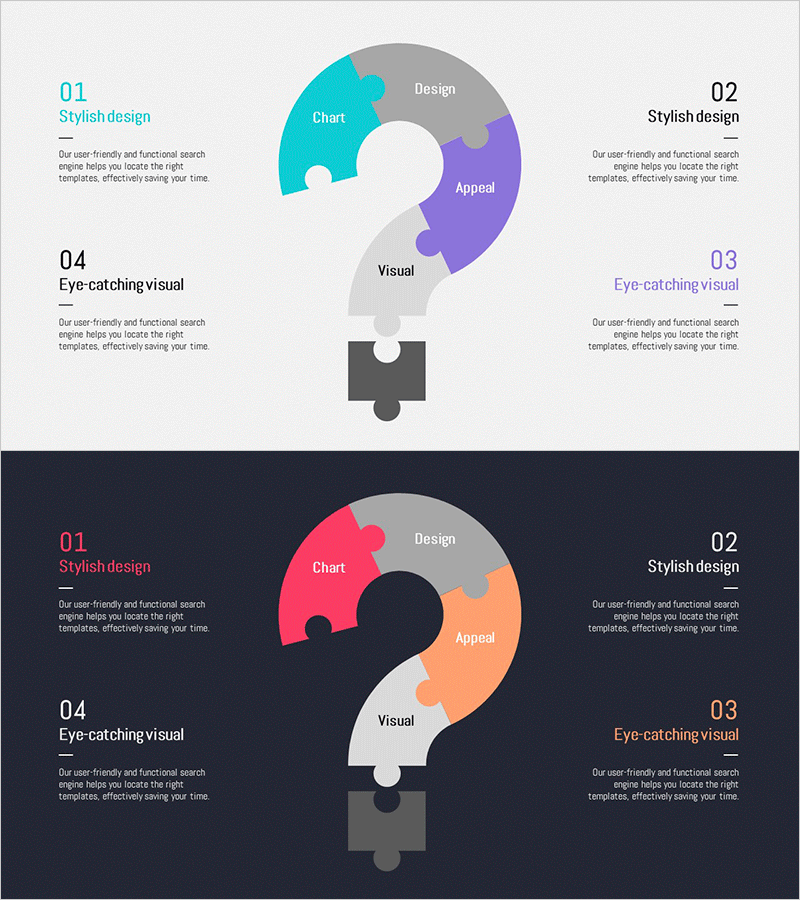
A four-section circular connection diagram PowerPoint slide featuring a central puzzle-shaped connector linking Design, Chart, Appeal, and Visual segments. Each section is color-coded for clear distinction and visual hierarchy. Two design variations are provided: a light background version with cyan, purple, gray, and white accents, and a dark background version with pink, orange, gray, and black tones. Ideal for energy sector, business strategy, and systems analysis presentations where demonstrating relationships and balance among key components is essential.
Usage Points
-
Main Usage
Visualizes the interconnected relationships and balance among four core business elements using a circular structure. Effectively communicates how different departments or functions interact within complex systems such as energy, manufacturing, or financial operations.
-
How to Use
Use as a key-element introduction slide in business strategy presentations or within business model analysis sections to explain component interactions. Light background suits general meetings and client presentations; dark background works for executive briefings and premium presentations.
-
Recommended For
Energy and power sector professionals, business strategy teams, consulting firms, investment pitch presenters, and product development teams explaining element relationships. Suitable for executive reports, strategy meetings, and client proposals.
-
Slide Structure
Central puzzle-shaped connector anchors four color-coded sections (Design, Chart, Appeal, Visual) arranged in circular formation. Two-slide set includes light background version (light gray, cyan, purple, white) and dark background version (dark navy, pink, orange, gray).
Related Products
-

Vibrant Color Box PPT Composition Contents
#Product/Service Introduction #Technical Approach #Diagram
-

Instrument Components Connection Diagram – Visualizing Service Composition
#Product/Service Introduction #Technical Approach #Diagram
-

Decoding the 3 Embedded Keywords - Concept Visualization through Diagram
#Product/Service Introduction #Technical Approach #Diagram
-

Fountain Pen History Diagram – Emphasizing Corporate Identity
#Company Introduction #Product/Service Introduction #Diagram
