Orange & Green Future Outlook Bar Graph
RB0800012_5
- Last Update 03/20/2025
- File Size 3.8MB
- # of Slides 2
- File Format PPTX
- Slide Ratio 4:3
- Color
Keywords
- #Content-Based Slides
- #Design-Based Slides
- #Business Strategy
- #Market and Competitor Analysis
- #Graph
- #Text Box
- #Financial Outlook & Expected Impact
- #Future Outlook
- #Column
- #Column Chart
- #Speech Bubble
- #4:3
- #bar chart PowerPoint
- #revenue forecast slide
- #business analysis presentation
- #data comparison graph
- #PowerPoint slide template download
About the Product
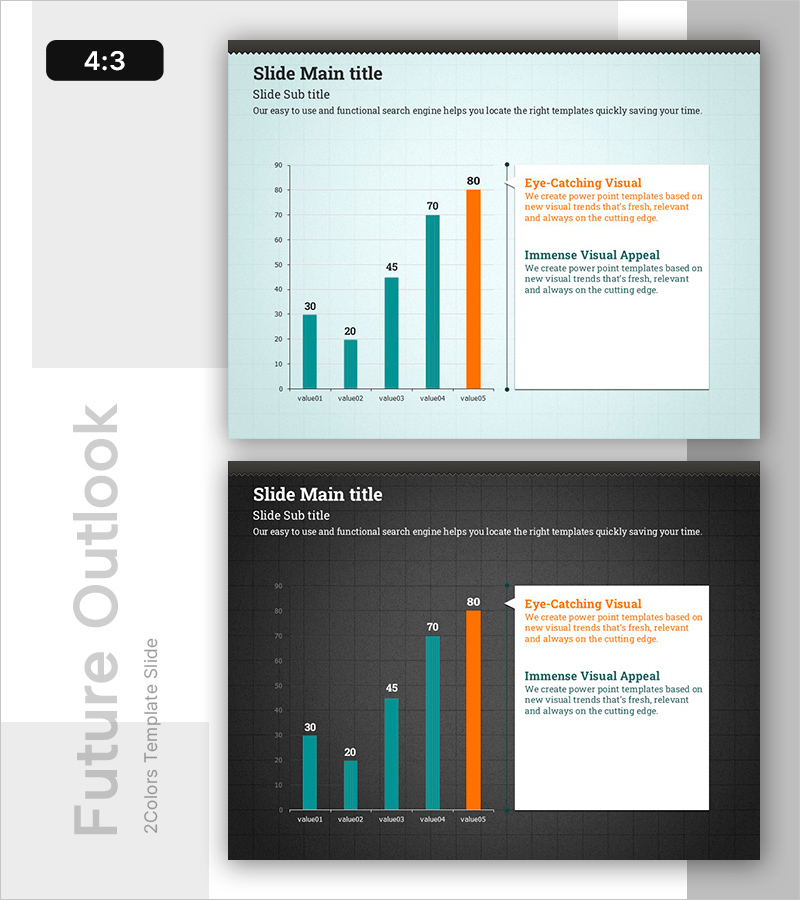
A vertical bar chart PowerPoint slide designed to visualize business outlook and revenue analysis across five data points. The light mint background contrasts with teal and orange bars that clearly differentiate data series, while the final bar in accent orange highlights key metrics. An integrated text box area on the right enables simultaneous presentation of chart interpretation and strategic insights. This 4:3 aspect ratio, 2-slide template is ready for immediate editing and customization.
Usage Points
-
Main Usage
Present quantitative business data such as revenue forecasts, strategic initiatives, and future projections through comparative bar visualization. The five-item layout allows intuitive comparison of values by bar height, while the accent-colored bar emphasizes peak performance or target achievement.
-
How to Use
Replace bar heights and numerical values with your actual data, then populate the right-side text box with chart interpretation, strategic recommendations, and key insights. Colors can be adjusted to match corporate branding. The 2-slide format enables seamless repetition for multiple comparative analyses in sequence.
-
Recommended For
Executive reports, business plan presentations, quarterly performance reviews, investor pitch decks (IR), marketing strategy meetings, and financial status briefings. Ideal for CFOs, business development managers, marketing professionals, and management consultants who need to communicate revenue trends, performance metrics, and growth targets.
-
Slide Structure
Light mint background with a 2/3 left-side vertical bar chart (four teal bars and one orange accent bar representing five data points), and a 1/3 right-side text area with title, subtitle, and description fields. Y-axis ranges from 0 to 90 with gridlines; numerical values displayed above each bar. Consistent 4:3 layout across both slides.
Related Products
-

Technology Service Future Outlook and Expected Effect – High-Quality Graph Design
#Business Strategy #Market and Competitor Analysis #Graph
-

Denim PPT Vertical Bar Graph Analysis – Market and Competitor Analysis
#Business Strategy #Market and Competitor Analysis #Graph
-

Column Chart for Market and Competitor Analysis – Modern Business Strategy
#Business Strategy #Market and Competitor Analysis #Graph
-

Growth Prospects Graph – Business Strategy Development
#Business Strategy #Market and Competitor Analysis #Graph
