Comparison Graph Before and After Growth – Business Insights
RJ0800030_15
- Last Update 08/08/2025
- File Size 3.6MB
- # of Slides 2
- File Format PPTX
- Slide Ratio 16:9
- Color
Keywords
- #Content-Based Slides
- #Design-Based Slides
- #Business Strategy
- #Market and Competitor Analysis
- #Graph
- #Financial Outlook & Expected Impact
- #Future Outlook
- #Column
- #Column Chart
- #16:9
- #horizontal bar chart PowerPoint
- #comparison graph slide
- #growth analysis presentation
- #business forecast PPT
- #data comparison template
About the Product
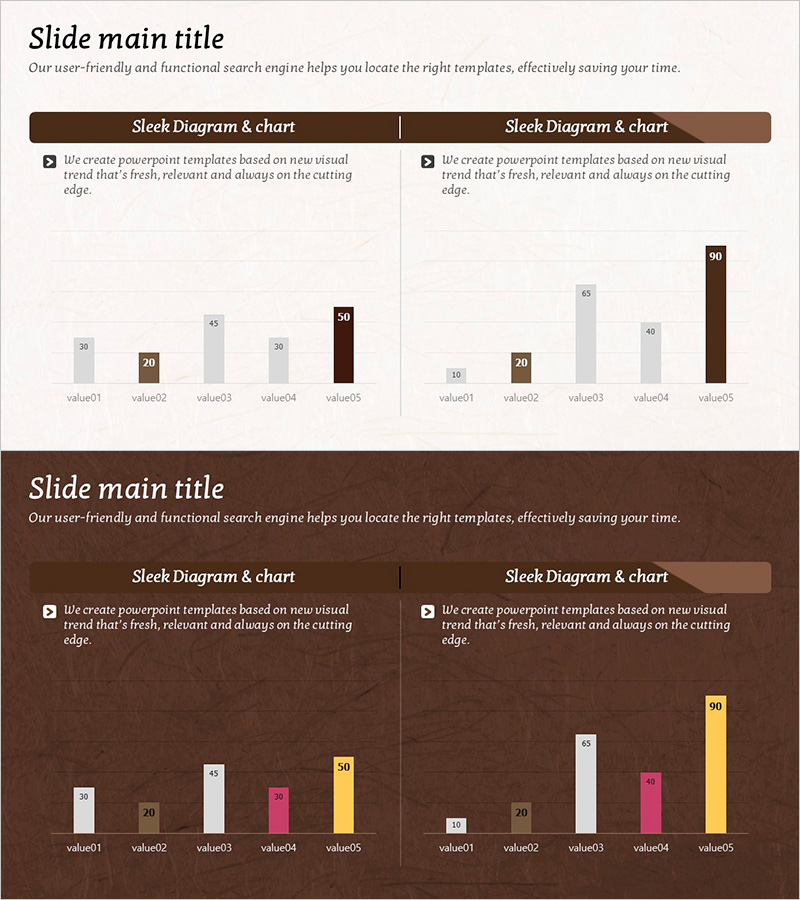
A horizontal bar comparison chart PowerPoint slide that visually contrasts business growth before and after metrics. This presentation template displays five data items in a side-by-side format to clearly communicate changes and performance outcomes. Featuring a brown background with gray and brown bars, this slide deck is ready to use for business forecasts, market analysis, revenue comparisons, and strategic planning. The two-slide set includes both light and dark background versions, providing flexibility to match your presentation design and audience environment.
Usage Points
-
Main Usage
Visualize business performance metrics and growth indicators using a side-by-side bar comparison format. The five-item layout enables quick assessment of improvement across different categories, making it ideal for presenting quantitative results, performance reports, and strategic forecasts to stakeholders.
-
How to Use
Insert this slide into business plans, quarterly reports, investor pitches, and strategic presentations. Edit the bar values and category labels to reflect your actual data—such as revenue growth, customer acquisition, market share expansion, or operational efficiency gains. The dual background versions allow seamless integration into different presentation themes.
-
Recommended For
Business analysts, marketing strategists, financial managers, and executives presenting performance metrics and growth comparisons. Particularly effective for year-over-year analysis, competitive benchmarking, departmental performance reviews, and investor relations presentations.
-
Slide Structure
Two-slide set, each containing a five-item horizontal bar chart. Slide 1 features a light beige background with gray and brown bars; Slide 2 uses a dark brown background with white, pink, and yellow accent bars for visual variety and presentation flexibility.
Related Products
-

Elevation Graph Above Sofa Image - Visualizing Business Growth
#Business Strategy #Market and Competitor Analysis #Graph
-

Technology Service Future Outlook and Expected Effect – High-Quality Graph Design
#Business Strategy #Market and Competitor Analysis #Graph
-

Utilization Rate of Oriental Medicine Clinics by Age – Market and Competitor Analysis
#Business Strategy #Market and Competitor Analysis #Graph
-

Analysis and Graphs in Future Prediction – Market Strategy and Profitability
#Business Strategy #Market and Competitor Analysis #Diagram
